Chief Economist Eugenio J. Alemán discusses current economic conditions.
This week’s headline inflation, or headline consumer price index (CPI), number was very disappointing, but not because it was too high. It was actually very low. The reason it was disappointing was because it was not low enough. And the reason why it was not low enough was the most concerning data point within the release because we run, potentially, the risk for inflation to continue to increase if we happen to suffer another energy related shock in the coming months and quarters. Still, barring another shock, we believe inflation will continue to trend down.
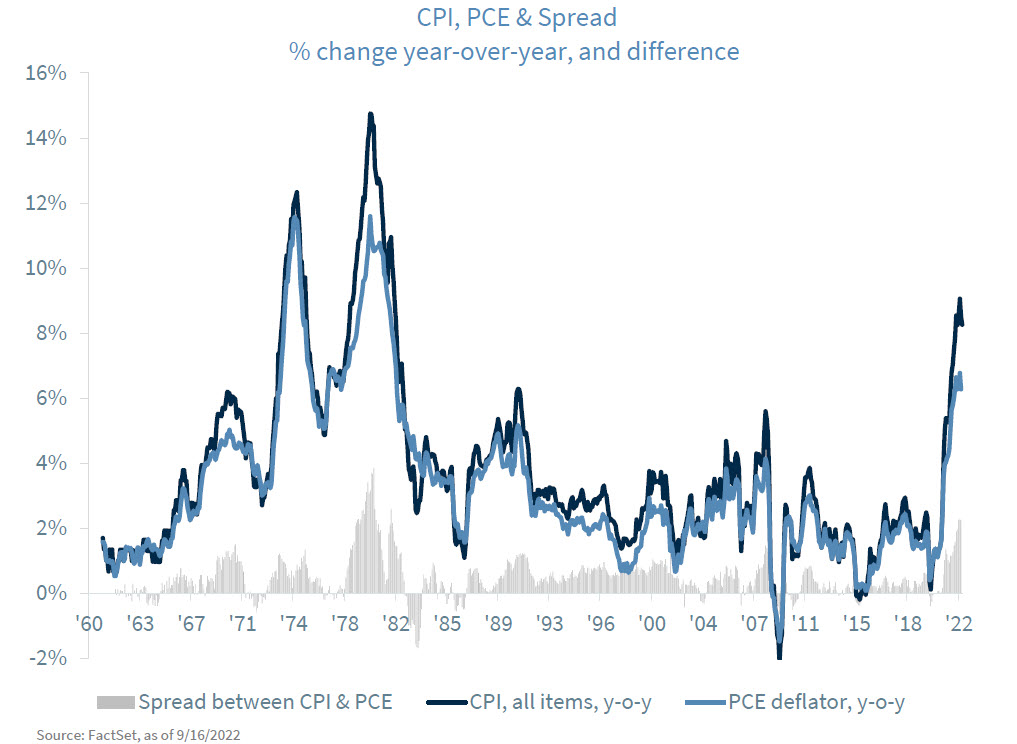
Core CPI prices, which are prices excluding volatile food and energy components, are growing too fast to guarantee that inflation would continue to go down in the coming months and quarters if there is a rebound in energy prices. One of the distinguishing—and worrisome—features of this inflation episode is that core CPI prices have been moving higher compared to previous relatively high inflation periods. As the graph below shows, core CPI has remained very low since the mid-1990 even during periods when the headline number increased considerably, like in the early 2000’s, from 2004 to 2006, and from 2007 to 2008, just to give some examples.
However, CPI prices are not as important for the Federal Reserve (Fed) as the Fed does not target CPI for conducting monetary policy. However, since CPI comes in first, news media and analysts are used to taking this number as the most important in terms of inflation. However, the most important inflation indicators for the Fed are the overall PCE deflator and the core PCE deflator, which are going to be released on September 30. This report will give a better picture of what is really happening to inflation (for more details on the difference see our section on “Thoughts on the Market” released on September 13, 2022).
In general, and with few historical exceptions, the higher CPI inflation is, the larger is the spread between the CPI and PCE deflator. And today is no exception. The spread between the year-over-year CPI and PCE in July of this year (July is the latest available PCE deflator number) was 2.25 percentage points, one of the highest since a spread of 2.60 percentage points in September of 1981. This means that the higher the rate of CPI inflation is, the higher is the probability that Americans continue to shift away from more expensive goods and select cheaper alternatives, putting an upper bound on prices.
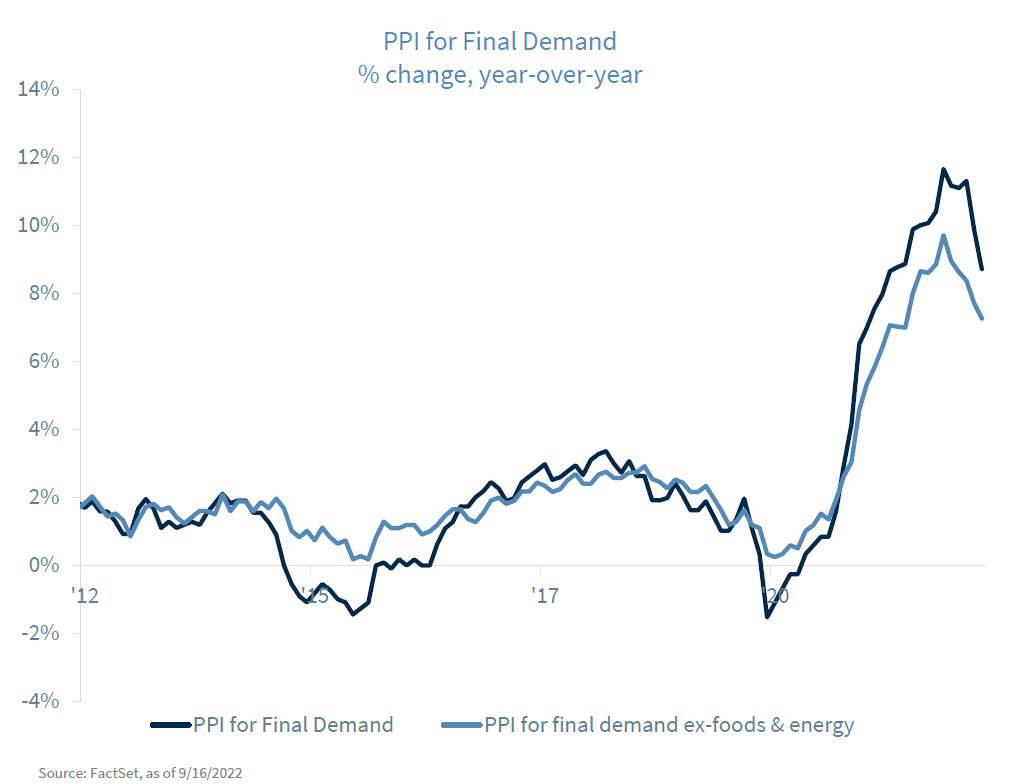
Furthermore, we also got another number this week that garnered less attention than the CPI report. This was the report on the producer price index (PPI) for final demand, which came in at -0.1% in August after a decline of 0.4% during the month of July. And this was very important because the year over year PPI for final demand went down from 9.85% in July to 8.72% in August while the PPI for final demand less foods and energy declined from 8.37% in July to 7.26% in August (see graph below). This means that, barring any shock to energy and food prices in the future, inflation at the consumer level will continue to trend down.
The reason for this is that these three measures of inflation have been highly correlated over time, with the PCE having a 98.4% correlation to CPI and a 97.4% correlation with PPI since after the Great Recession.
Thus, our forecast for the August headline PCE if for an increase of close to 0.05% while we estimate the core PCE to increase by approximately 0.3%. If our forecast were to be correct, then the year-over-year headline PCE will fall below 6% for the first time this year. Meanwhile, the core PCE will fall to 4.5% on a year earlier basis.
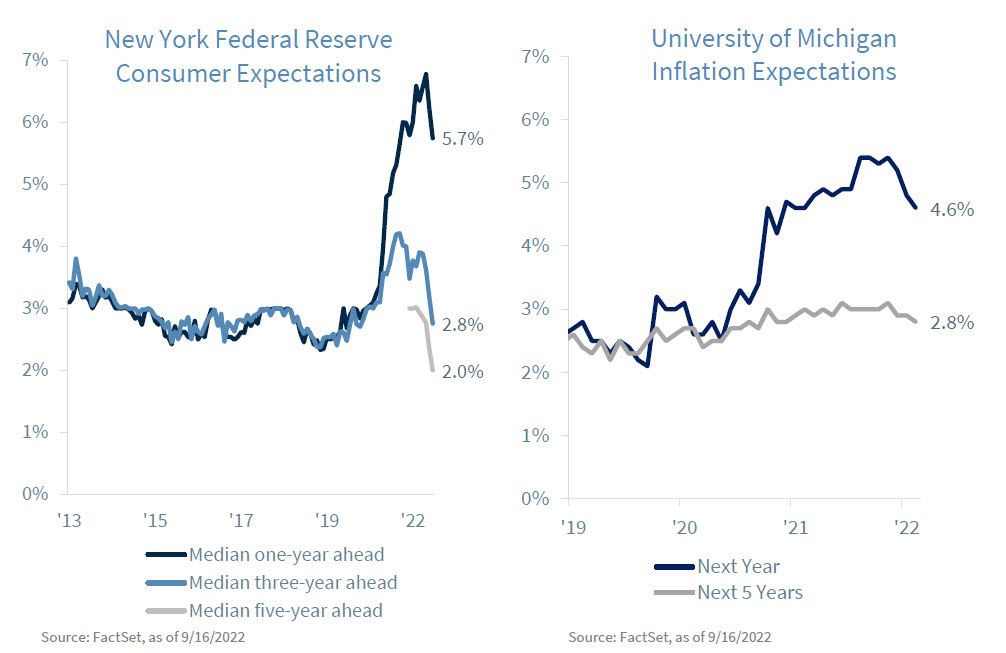
But there was more news that was overshadowed by the higher-than-expected CPI report. The survey of consumer expectations from the New York Federal Reserve was also released and showed further improvement in all measures of inflation expectations, one-year, three-year, as well as five-year.
The median one-year and three-year-ahead inflation expectations were down again in August, according to the Survey of Consumer Expectations. The one-year-ahead declined from 6.2% to 5.7% while three- year-ahead inflation expectations declined from 3.2% in July to 2.8% in August. Meanwhile, the five-year- ahead median inflation expectation, a data point that started to be collected at the beginning of this year, also declined, from 2.3% in July to 2.0% in August.
Meanwhile, the September preliminary University of Michigan inflation expectations for one-year-ahead and five-year-ahead continued to trend down as well, with the one-year-ahead index coming down to 4.6% from 4.8% in August while the five-year-ahead index slowing down to 2.8% compared to 2.9% in August.
This means that Fed officials should take these expectations into consideration during their decision- making process as the current environment is nothing compared to what was happening back in the 60s, 70s, and 80s, when inflation expectations were running wild, and the Fed needed to take drastic measures to bring those inflation expectations down. For now, what they have done seems to be enough to bring inflation down to their 2.0% target.
Alternative Scenarios:
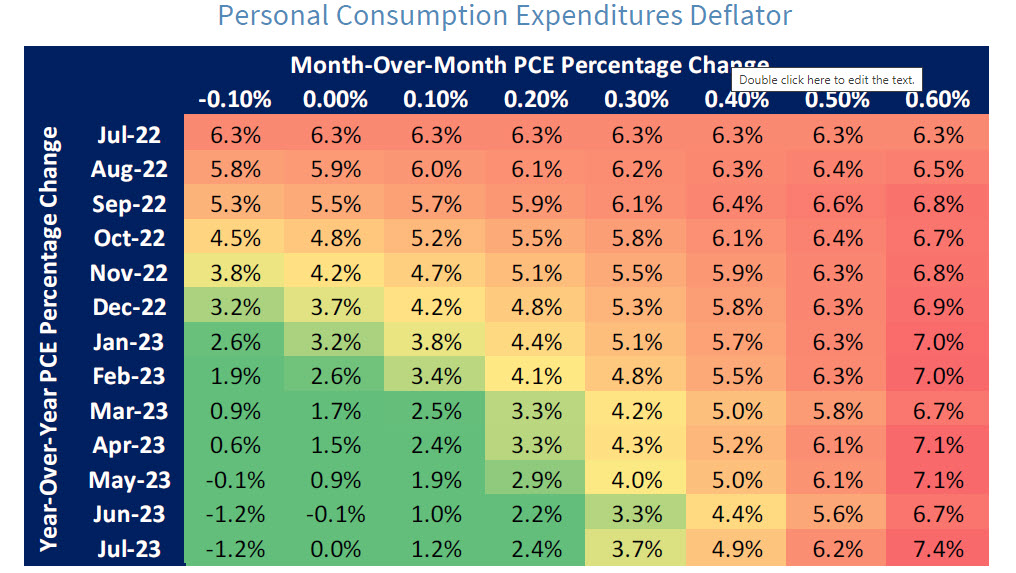
Below, we provide two tables of different scenarios for both, the PCE deflator and the CPI over the next year so we can see how inflation is going to evolve according to these scenarios. Of course, these scenarios assume that inflation will be the same for each month so it is an oversimplification. However, it gives an idea of what are the monthly rates of inflation that will allow the Fed to get to the 2.0% target for the PCE deflator.
We Have Revised Our Forecast
Recent events and our expectations for a higher federal funds rate has prompted us to revise our forecast for both the Federal Reserve (Fed) federal funds rate as well as for the US economy for 2023. We have not revised our forecast for this year’s GDP growth. However, we have brought down our forecast for 2023. Our forecast for 2023 was 0.0% while our new forecast is for GDP to decline 0.5% for the whole of 2023 with a recession starting during the first quarter of 2023 and ending in the third quarter of 2023.
Meanwhile, we have increased our federal funds rate estimate at the end of 2022 to 3.75% to 4.00% from our previous expectations for a 3.25% to 3.50%.
We remain on the camp that believes that inflation will continue to slow down going forward and that the Fed will not have to increase interest rates past 4.0% but right now the camp that believes we need a deeper recession to bring the rate of unemployment considerably higher seems to have the upper hand today. However, we still think that our expectations will come through and the Fed will not have to increase the federal funds rate much higher than what we expect today.
Economic and market conditions are subject to change.
Opinions are those of Investment Strategy and not necessarily those Raymond James and are subject to change without notice the information has been obtained from sources considered to be reliable, but we do not guarantee that the foregoing material is accurate or complete. There is no assurance any of the trends mentioned will continue or forecasts will occur last performance may not be indicative of future results.
Consumer Price Index is a measure of inflation compiled by the US Bureau of Labor Studies. Currencies investing are generally considered speculative because of the significant potential for investment loss. Their markets are likely to be volatile and there may be sharp price fluctuations even during periods when prices overall are rising.
Consumer Sentiment is a consumer confidence index published monthly by the University of Michigan. The index is normalized to have a value of 100 in the first quarter of 1966. Each month at least 500 telephone interviews are conducted of a contiguous United States sample.
The producer price index is a price index that measures the average changes in prices received by domestic producers for their output. Its importance is being undermined by the steady decline in manufactured goods as a share of spending.
Industrial production: Industrial and production engineering is a measure of output of the industrial sector of the economy. The industrial sector includes manufacturing, mining, and utilities.
Personal Consumption Expenditures Price Index (PCE): The PCE is a measure of the prices that people living in the United States, or those buying on their behalf, pay for goods and services. The change in the PCE price index is known for capturing inflation (or deflation) across a wide range of consumer expenses and reflecting changes in consumer behavior.
FHFA house price index is a quarterly index that measures average changes in housing prices based on sales or refinancing’s of single-family homes whose mortgages have been purchased or securitized by Fannie Mae or Freddie Mac.
Consumer confidence index is an economic indicator published by various organizations in several countries. In simple terms, increased consumer confidence indicates economic growth in which consumers are spending money, indicating higher consumption.
ISM Manufacturing indexes are economic indicators derived from monthly surveys of private sector companies.
ISM Services Index is an economic index based on surveys of more than 400 non-manufacturing (or services) firms’ purchasing and supply executives.
Non-Manufacturing Business Activity Index is a seasonally adjusted index released by the Institute for Supply Management measuring business activity and conditions in the United States service economy as part of the Non-Manufacturing ISM Report on Business.
New orders index measures the value of the orders received in the course of the month by French companies with over 20 employees in the manufacturing industries working on orders.
Source: FactSet, data as of 6/3/2022
Markets & Investing Members of the Raymond James Investment Strategy Committee share their views on...
Markets & Investing Review the latest Weekly Headings by CIO Larry Adam. Key Takeaways ...
Technology & Innovation Learn about a few simple things you can do to protect your personal information...