Chief Economist Eugenio J. Alemán discusses current economic conditions.
Many have been asking this question since earlier this year, a question that has no easy answer. As economists – us included – continue to forecast the most ‘telegraphed’ recession in history, it is important to point to those things that make this economic cycle very different from past economic cycles. These differences are having an undeniable effect on Americans’ ability to weather the higher interest rate storm and is making the economy’s response to higher rates very different than in previous cycles.
First of all, this was not a typical monetary cycle and thus, the cycle is not showing the same characteristics of a typical end of a monetary cycle. Normally, the Federal Reserve (Fed) decreases interest rates to reactivate the economy through one of its monetary channels: lower interest rates increase lending by banks through the money multiplier effect. That is, the Fed buys Treasurys from the market, injecting liquidity into the market and thus lowering interest rates. Then banks/financial institutions lend those funds to customers, increasing the money supply. The cycle reverses when the Fed decides to sell Treasurys into the market in order to “dry” it from excess liquidity, which makes banks reduce lending, reversing the growth in money supply. Sometimes, during the monetary expansion cycle, borrowing increases so much that individuals and households get into trouble because they cannot continue to pay their debts, especially if employment deteriorates. A very similar process happens with firms, as credit becomes cheaper, and firms increase investments.
In a nutshell, and perhaps a bit oversimplified, this is what a normal monetary cycle looks like. So, when the Fed pulls the trigger and starts increasing interest rates, those individuals who lose their jobs in a downturn get in trouble. Also, firms that invested too much find it difficult to pay back their debts during a recession.
But the period during the COVID-19 pandemic was not a normal monetary cycle. Yes, money supply skyrocketed, but not because banks lent money to individuals and/or firms. The money supply surged because fiscal policy was extremely expansive: a $1,200 check for everybody on April of 2020, a $600 check for everybody on December 2020, a $1,400 check for everybody on March 2021 plus monies from the Paycheck Protection Program (PPP) loans available to businesses from April 2020 until May 2021, etc.
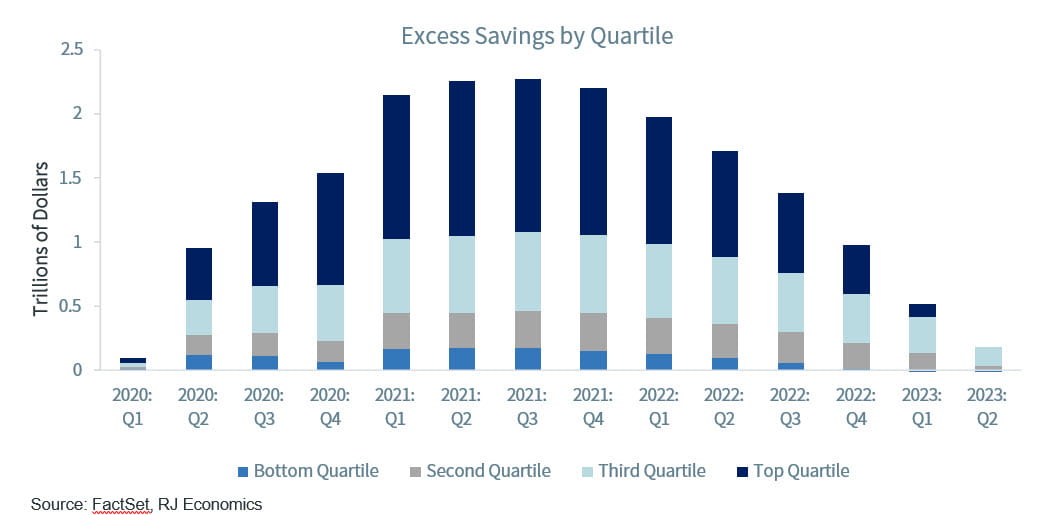
Meanwhile, the economy remained closed for many months, with individuals and households spending and buying goods through mobile apps as well as through the internet while services consumption was curtailed because of the fear of contagion. This allowed individuals, households, and through PPP loans, businesses, to accumulate much of the transfers from the government and thus the savings rate surged during the period. Above is a graph with the estimate of excess savings during the COVID-19 recession and how it is expected to come down going forward.
The Missing Link
This means that today, if there is a contraction in credit, it would not affect individuals, households, and firms as it would have been the case during a normal monetary tightening cycle. Yes, higher interest rates are pricing many Americans out of the housing market, and this is weakening the housing market, but this is not a ‘crisis’ similar to what we had during the Great Recession. Furthermore, although mortgage interest rates have increased considerably, it is only affecting those who buy new houses and existing homes at current mortgage rates and not the majority of Americans who have a very low fixed mortgage rate at a time when inflation is high, and salaries and wages are increasing, thus reducing the burden of those mortgages on real incomes as well as on Americans’ ability to pay for those mortgages, which is what the graph on mortgage debt service payments below is clearly showing.
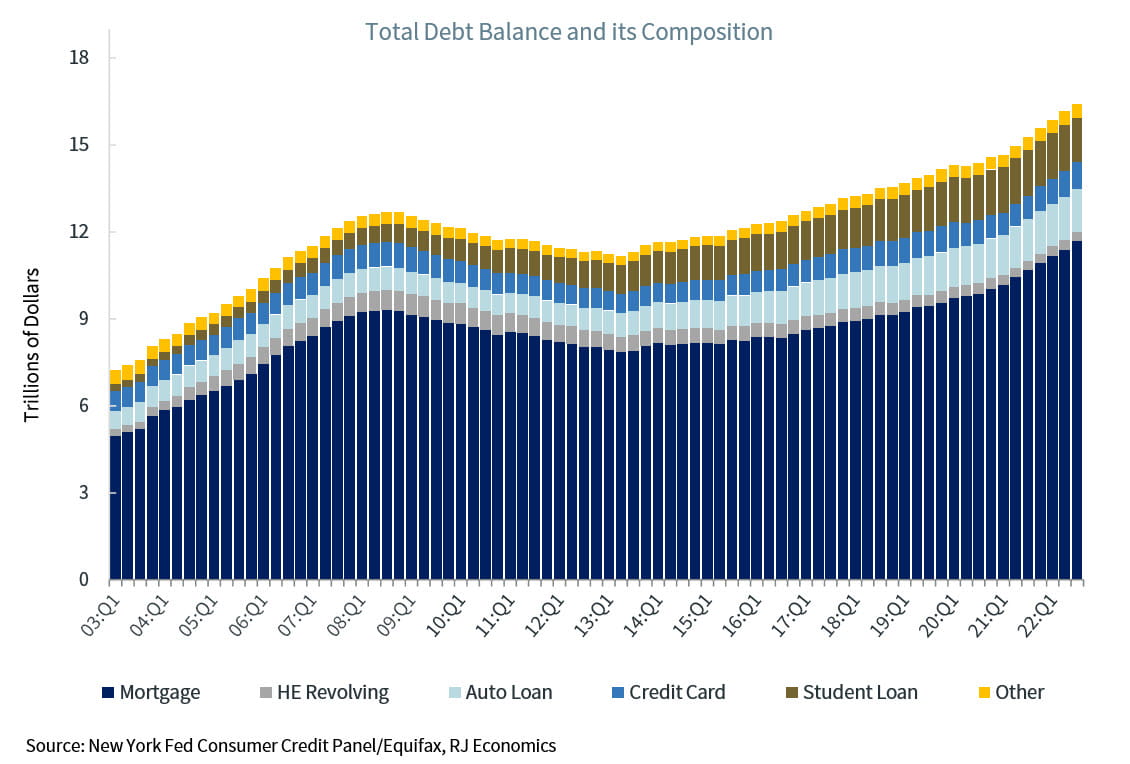
All these is good news if we expect, as we do, that the U.S. economy is going to enter a recession next year. Although total debt balances have continued to increase, as shown by the graph below, debt service ratios have continued to decline or have remained at historically low levels, which puts today’s household financial conditions in a much better place than in the past when facing a potential recession.
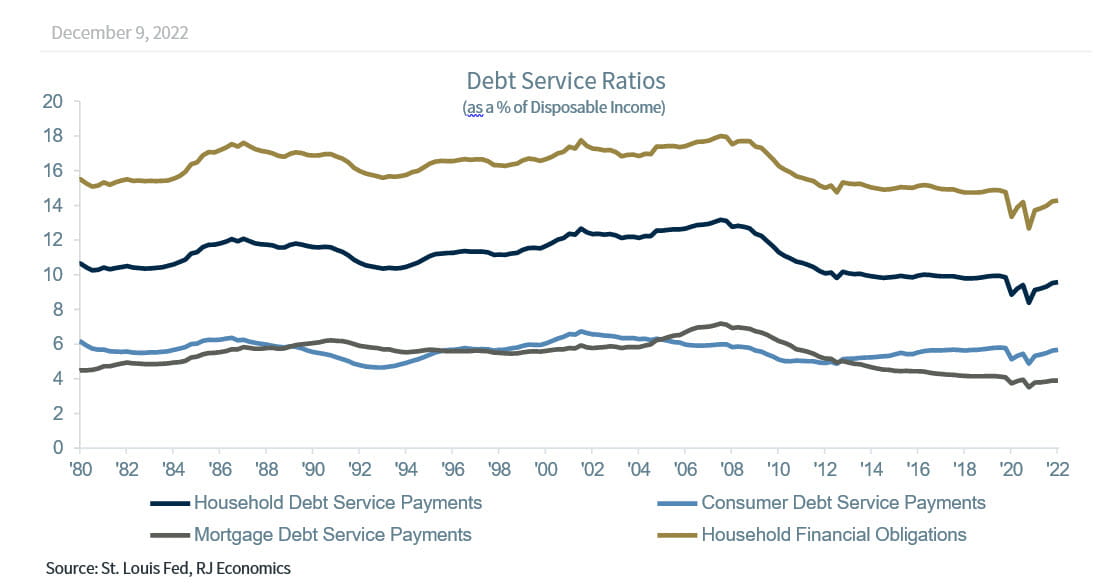
As we mentioned above, it is important to note that although mortgage debt is at a historic high today, mortgage debt service payments are at a historical low-level as a percentage of disposable personal income today thanks to the low interest rates Americans have enjoyed during the last several decades as well as the increase in incomes. Furthermore, these very low interest rates have helped push the household financial obligations ratio to a more than 60 year low. Perhaps the only problematic debt service ratio today is the one on consumer debt, which includes credit card debt payments as well as automobile debt payments. Although this component of debt is still very low, it is not at historical lows in terms of disposable personal income, as the rest of the debt ratios are today. Furthermore, credit card debt has the added disadvantage that interest rates on credit cards are not fixed and thus we expect this debt service payment ratio to continue to increase due to higher interest rates on credit cards as well as more Americans increasing their purchases with credit cards.
What is Going to Give?
The above explanation is an important, if not the most important, reason why we believe that the U.S. economy will suffer a mild recession rather than a deeper recession during 2023. However, there is still a possibility that we do not experience a recession because households and individuals are in a better position today to weather a recession. But this will depend on the labor market’s ability to remain strong and not falter under higher interest rates pressures coming from the Fed.
Many argue that the Fed needs to push the U.S. economy into a recession to bring down inflation. We disagree. The Fed needs to bring economic growth below potential, which is, today, estimated at about 1.8% per year. Average economic growth during the last two years has been at about 5.0%, way above potential GDP growth, and this is the fundamental reason why inflation is so high today.
If the Fed is able to keep economic growth below potential for several years (which is our forecast), then inflation is going to continue to slowdown. But this requires a lot of fine tuning, and the monetary instruments at the disposal of the Fed are not very good instruments to use for fine tuning. They are very blunt and thus can bring the economy into a deeper recession if the Fed doesn’t show restraint.
We know that Fed economists and Fed officials have better—and timelier—information about the state of the U.S. economy and that they know these issues better than we do. Thus, we expect them to exercise restrain and patience when deciding on further monetary policy moves going forward.
Economic and market conditions are subject to change.
Opinions are those of Investment Strategy and not necessarily those Raymond James and are subject to change without notice the information has been obtained from sources considered to be reliable, but we do not guarantee that the foregoing material is accurate or complete. There is no assurance any of the trends mentioned will continue or forecasts will occur last performance may not be indicative of future results.
Consumer Price Index is a measure of inflation compiled by the U.S. Bureau of Labor Studies. Currencies investing are generally considered speculative because of the significant potential for investment loss. Their markets are likely to be volatile and there may be sharp price fluctuations even during periods when prices overall are rising.
Consumer Sentiment is a consumer confidence index published monthly by the University of Michigan. The index is normalized to have a value of 100 in the first quarter of 1966. Each month at least 500 telephone interviews are conducted of a contiguous United States sample.
Personal Consumption Expenditures Price Index (PCE): The PCE is a measure of the prices that people living in the United States, or those buying on their behalf, pay for goods and services. The change in the PCE price index is known for capturing inflation (or deflation) across a wide range of consumer expenses and reflecting changes in consumer behavior.
Consumer confidence index is an economic indicator published by various organizations in several countries. In simple terms, increased consumer confidence indicates economic growth in which consumers are spending money, indicating higher consumption.
The Consumer Confidence Index (CCI) is a survey, administered by The Conference Board, that measures how optimistic or pessimistic consumers are regarding their expected financial situation.
Leading Economic Indicators: The Conference Board Leading Economic Index is an American economic leading indicator intended to forecast future economic activity. It is calculated by The Conference Board, a non-governmental organization, which determines the value of the index from the values of ten key variables
Certified Financial Planner Board of Standards Inc. owns the certification marks CFP®, CERTIFIED FINANCIAL PLANNER™, CFP® (with plaque design) and CFP® (with flame design) in the U.S., which it awards to individuals who successfully complete CFP Board’s initial and ongoing certification requirements.
Currencies investing are generally considered speculative because of the significant potential for investment loss. Their markets are likely to be volatile and there may be sharp price fluctuations even during periods when prices overall are rising.
The STOXX Europe 600, also called STOXX 600, SXXP, is a stock index of European stocks designed by STOXX Ltd. This index has a fixed number of 600 components representing large, mid and small capitalization companies among 17 European countries, covering approximately 90% of the free-float market capitalization of the European stock market (not limited to the Eurozone).
Geographical Revenues: Overall country-specific revenues as a percentage of total revenues from a specific index such as the S&P 500 or the STOXX Europe 600.
Source: FactSet, data as of 9/30/2022
Markets & Investing Members of the Raymond James Investment Strategy Committee share their views on...
Markets & Investing Review the latest Weekly Headings by CIO Larry Adam. Key Takeaways ...
Technology & Innovation Learn about a few simple things you can do to protect your personal information...