Chief Economist Scott Brown discusses the latest market data.
As expected, the Federal Open Market Committee (FOMC) left short-term interest rates and the monthly pace of asset purchases unchanged. In its policy statement, the FOMC noted that “the economy had made progress” toward its goals. In his press conference, Fed Chair Powell indicated that an increase in short-term interest rates is still a long way off and not currently under discussion. However, Fed policymakers are debating a tapering of asset purchases, with a decision expected later this year (and the Fed will give plenty of advance notice).
Real GDP rose at a 6.5% annual rate in the advance estimate for 2Q21, held back by a larger reduction in inventories, increased imports (which have a negative sign in the GDP calculation), and lower government spending (relative to 1Q21). Consumer spending rose at an 11.8% annual rate (following 11.4% in 1Q21), while business fixed investment rose 8.0% (following 12.9%). Personal income edged up 0.1% in June, as a 0.7% gain in wage and salary income offset an 11.0% drop in unemployment benefits. Personal spending rose 1.0%, as a 1.2% gain in services offset a 1.5% decrease in spending on durable goods. The PCE Price Index rose 0.5% in June (+4.0% y/y), up 0.5% (+3.5% y/y) ex-food and energy. The Employment Cost Index rose 0.7% in the three months ending in June (+2.9% y/y, slightly higher than the +2.7% y/y figure for June 2020). Wages and salaries rose 0.9% (+3.2% y/y), while benefit costs rose 0.4% (+2.2% y/y).
Next week: The ISM surveys should remain strong. The Employment Report will be subject to seasonal noise. Prior to the pandemic, we would normally lose around 1.3 million (unadjusted) education jobs each July. As we saw in the June report, fewer teachers hired means fewer job losses – and a seasonally adjusted increase – at the end of the school year. Outside of education, the economy likely added jobs at a strong clip, but one should take the headline payroll figure with a grain of salt. We still have a long way to go for a full labor market recovery.
Indices
| Last | Last Week | YTD return % | |
|---|---|---|---|
| DJIA | 35,084.53 | 34,823.35 | 14.63% |
| NASDAQ | 14,778.26 | 14,684.60 | 14.66% |
| S&P 500 | 4,419.15 | 4,367.48 | 17.65% |
| MSCI EAFE | 2,341.81 | 2,311.97 | 9.05% |
| Russell 2000 | 2,240.81 | 2,311.97 | 13.43% |
Consumer Money Rates
| Last | 1 year ago | |
|---|---|---|
| Prime Rate | 3.25 | 3.25 |
| Fed Funds | 0.08 | 0.08 |
| 30-year mortgage | 2.86 | 2.88 |
Currencies
| Last | 1 year ago | |
|---|---|---|
| Dollars per British Pound | 1.3947 | 1.396 |
| Dollars per Euro | 1.188 | 1.185 |
| Japanese Yen per Dollar | 109.77 | 104.73 |
| Canadian Dollars per Dollar | 1.244 | 1.342 |
| Mexican Peso per Dollar | 19.832 | 22.024 |
Commodities
| Last | 1 year ago | |
|---|---|---|
| Crude Oil | 73.48 | 39.92 |
| Gold | 1825.70 | 1966.80 |
Bond Rates
| Last | 1 month ago | |
|---|---|---|
| 2-year treasury | 0.19 | 0.26 |
| 10-year treasury | 1.25 | 1.48 |
| 10-year municipal (TEY) | 1.307 | 1.569 |
Treasury Yield Curve – 07/30/2021

As of close of business 07/29/2021
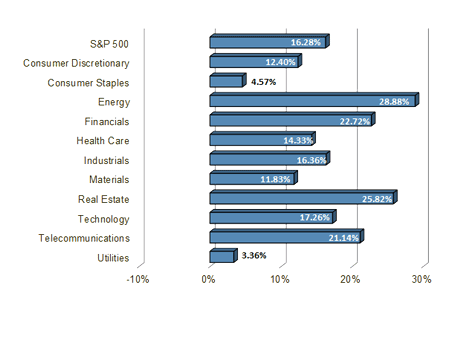
S&P Sector Performance (YTD) – 07/30/2021
Economic Calendar
| August 2 | — | Construction Spending (June) |
| — | ISM Manufacturing Index (July) | |
| August 4 | — | ISM Services Index (July) |
| Factory Orders (June) | — | |
| August 5 | — | ADP Payroll Estimate (July) |
| — | ISM Services Index (July) | |
| August 6 | — | Employment Report (July) |
| August 11 | — | Consumer Price Index (July) |
| August 17 | — | Retail Sales (July) |
| August 3 | — | Employment Report (August) |
| September 6 | — | Labor Day Holiday (markets closed) |
| September 22 | — | FOMC Policy Decision |
All expressions of opinion reflect the judgment of the author and are subject to change. There is no assurance any of the forecasts mentioned will occur or that any trends mentioned will continue in the future. Investing involves risks including the possible loss of capital. Past performance is not a guarantee of future results. International investing is subject to additional risks such as currency fluctuations, different financial accounting standards by country, and possible political and economic risks, which may be greater in emerging markets. While interest on municipal bonds is generally exempt from federal income tax, it may be subject to the federal alternative minimum tax, and state or local taxes. In addition, certain municipal bonds (such as Build America Bonds) are issued without a federal tax exemption, which subjects the related interest income to federal income tax. Municipal bonds may be subject to capital gains taxes if sold or redeemed at a profit. Taxable Equivalent Yield (TEY) assumes a 35% tax rate.
The Dow Jones Industrial Average is an unmanaged index of 30 widely held stocks. The NASDAQ Composite Index is an unmanaged index of all common stocks listed on the NASDAQ National Stock Market. The S&P 500 is an unmanaged index of 500 widely held stocks. The MSCI EAFE (Europe, Australia, Far East) index is an unmanaged index that is generally considered representative of the international stock market. The Russell 2000 index is an unmanaged index of small cap securities which generally involve greater risks. An investment cannot be made directly in these indexes. The performance noted does not include fees or charges, which would reduce an investor’s returns. U.S. government bonds and treasury bills are guaranteed by the US government and, if held to maturity, offer a fixed rate of return and guaranteed principal value. U.S. government bonds are issued and guaranteed as to the timely payment of principal and interest by the federal government. Treasury bills are certificates reflecting short-term (less than one year) obligations of the U.S. government.
Commodities trading is generally considered speculative because of the significant potential for investment loss. Markets for commodities are likely to be volatile and there may be sharp price fluctuations even during periods when prices overall are rising. Specific sector investing can be subject to different and greater risks than more diversified investments. Gross Domestic Product (GDP) is the annual total market value of all final goods and services produced domestically by the U.S. The federal funds rate (“Fed Funds”) is the interest rate at which banks and credit unions lend reserve balances to other depository institutions overnight. The prime rate is the underlying index for most credit cards, home equity loans and lines of credit, auto loans, and personal loans. Material prepared by Raymond James for use by financial advisors. Data source: Bloomberg, as of close of business July 22, 2021.
Markets & Investing Members of the Raymond James Investment Strategy Committee share their views on...
Markets & Investing Review the latest Weekly Headings by CIO Larry Adam. Key Takeaways ...
Technology & Innovation Learn about a few simple things you can do to protect your personal information...