Chief Economist Scott Brown discusses current economic conditions.
Nonfarm payrolls continued to recover in September, although the pace of improvement has slowed and we are unlikely to return to February levels until the pandemic is well behind us. The impact of COVID-19 has been uneven, with job losses remaining more severe in lower-paying service industries. Consumer spending has improved, though mixed across sectors. Further fiscal support will be critical for the unemployed.
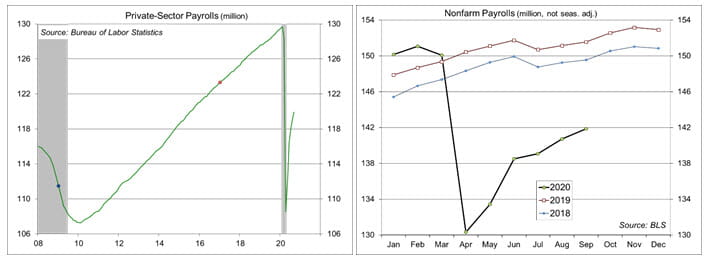
Nonfarm payrolls rose by 661,000 in the initial estimate for September, slower than in July (1.761 million) and August (1.489 million). There are two seasonal forces at play in September. We normally add jobs in education and lose those related to the summer travel season. This September, prior to seasonal adjustment, education jobs rose less than usual (1.160 million, vs. 1.445 million a year ago), while fewer non-education jobs were shed (-23,000, vs. -1.030 million a year ago). Less seasonal hiring implies fewer seasonal layoffs later on.
While much of the focus is on the pace of job growth, it’s important to take a step back and look at the longer-term picture. Payrolls fell by 22.1 million (14.5%) from February to April and have rebounded by 11.4 million (8.8%) from April to September. That still leaves us down by 10.7 million (7.0%). Weakness has been more severe in leisure and hospitality, but even “strong” sectors like manufacturing and construction are 5% or more below pre-pandemic levels.
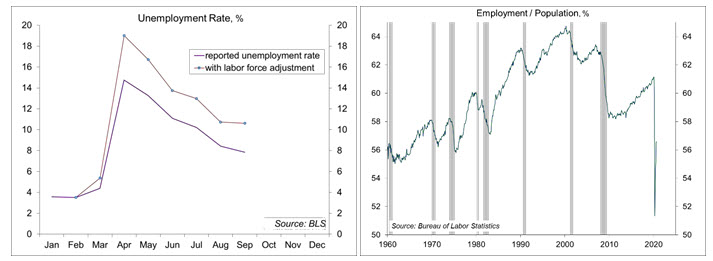
The unemployment rate edged down to 7.9% (from 8.4%), but mostly because people exited the labor force (to be counted as “unemployed,” you have to be actively looking for a job and many have given up.
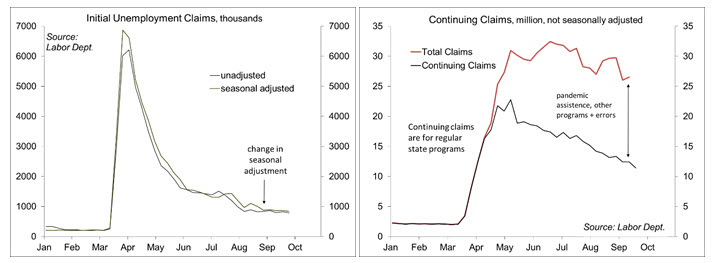
Weekly claims for unemployment benefits, while less horrific than in March and April, are still trending at an elevated level. People and businesses are getting used to living in a pandemic, and we can expect further job gains in the months ahead as the economy continues to recover. At the same time, as the pandemic continues, temporary layoffs are becoming permanent and firms can be expected to focus on cost-containment. Labor is typically the largest expense for most firms.
Job losses have weighed more heavily at the lower end of the income spectrum, but these aren’t big spenders. The top 20% of income earners account for more than half of personal income and more than half of consumer spending. White collar workers have been more able to work from home and to adapt to the pandemic. In turn, while nonfarm payrolls are still down 7.0% from February, overall consumer spending is down 3.4%. Spending on consumer durables, including motor vehicles, is higher than in February. Spending on clothing, gasoline, and consumer services won’t fully recover until the pandemic is in the past. Unfortunately, a vaccine is unlikely to be 100% effective, a third of the population may not take it, and even with a vaccine, many will be reluctant to venture out in crowds for some time.
The pandemic has had a positive impact on housing. Working from home is now expected to be long-lasting (if not permanent). If that’s the case, workers will seek larger homes with office space, in better locations. Mortgage rates are low, but prices are rising, reducing affordability, adding to issues of income and wealth inequality. Still, residential construction accounts for only about 3.5% of GDP.
Further fiscal support is needed, primarily for those still unemployed. Strains in state and local government budgets are also being felt, likely adding to job losses in the months ahead.
Recent Economic Data
Nonfarm payrolls by 661,000 in the initial estimate for September, still down 10.7 million (7.0%) from February. There were 41,000 fewer temporary census workers. Private-sector payrolls rose by 877,000, down 9.8 million (7.5%) from February. Manufacturing payrolls rose just 29,000 (down 647,000, or 5.0%, from February). Construction added just 16,000 (down 394,000, or 5.2%, from February.
The unemployment rate fell to 7.9%, vs. 8.4%. However, the unemployment rate typically understates the weakness in a downturn, as laid-off workers get tired of looking and drop out of the labor force. The employment/population ratio provides a better way to gauge the amount of slack in the job market. This ratio edged up to 56.6% in September, up from 51.3% in April, but down from February’s 61.1%. Expect for recent months, this ratio is the lowest in decades.
Unit motor vehicle sales rose to a 16.3 million annual rate in September (vs. 15.2 million in August).
The ISM Manufacturing Index edged down to 55.4 in September, from 56.0 in August, reflecting further growth in new orders and production. Manufacturers are getting used to operating in the pandemic. Increased demand and supply chain issues have led to some increases in prices, but this is likely to be transitional.
The Conference Board’s Consumer Confidence Index rose to 101.8 in the advance estimate for September, vs. 86.3 in August (it was 132.6 in February).
The Pending Home Sales Index rose 8.8% in August, up 24.2% from a year earlier.
Real GDP fell at a 31.4% annual rate in the 3rd estimate for 2Q20 (vs. -31.7% in the 2nd estimate).
Personal income fell 2.7% in the initial estimate for August, reflecting a 53.0% decrease in unemployment benefits. Private-sector wage and salary income rose 1.3%, although still down 4.2% from February.
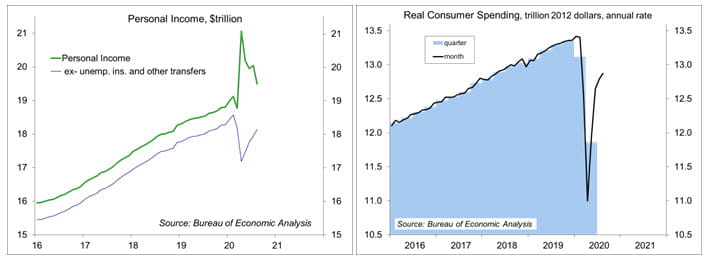
Personal spending rose 1.0% in August, up 0.7% adjusting for inflation. Real consumer spending (70% of Gross Domestic Product) appears on track for about a 38% annual rate in 3Q20 (vs. -33.2% in 2Q20 and -6.9% in 1Q20)
Personal spending rose 18.6% from April to August, but that’s not enough to offset the 18.6% decline in March and April (August spending was 3.4% lower than in February). Spending on consumer durables has surpassed pre-pandemic levels. While spending on clothing, gasoline, and consumer services have risen off their pandemic lows, the August level remained well below February’s level.
Gauging the Recovery
Jobless claims, a leading economic indicator, fell to 837,000 in the week ending September 26. However, California, which had accounted for around 30% of U.S. claims in recent weeks, announced a two-week Pause in processing claims. The four-week average was 867,250 – still an extremely high trend (although less horrific than in March and April). Continuing claims (for regular state unemployment insurance programs), a coincident economic indicator, fell by 980,000 (week ending September 19) to 11.767 million.
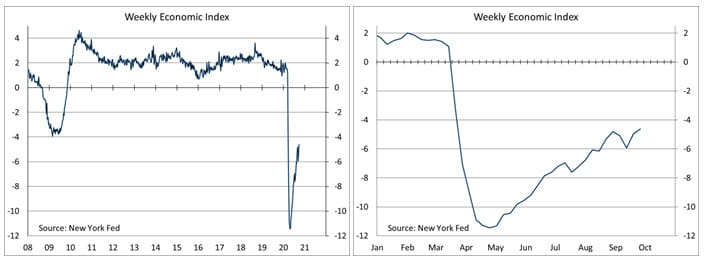
The New York Fed’s Weekly Economic Index rose to -4.62% for the week of September 26, up from -4.95% a week earlier (revised from -4.50%) and a low of -11.45% at the end of April, consistent with a moderation in the pace of the recovery. The WEI is scaled to four-quarter GDP growth (for example, if the WEI reads -2% and the current level of the WEI persists for an entire quarter, we would expect, on average, GDP that quarter to be 2% lower than a year previously). Note that the weekly figures are subject to revision
The University of Michigan’s Consumer Sentiment Index rose to 80.4 in the full-month assessment for September (the survey covered August 26 to September 28), vs. 78.9 at mid-month and 74.1 in August. The report noted that “the September survey recorded a significant increase in the proportion that expected a reestablishment of good times financially in the overall economy.” However, “the recent gains, while encouraging, were largely due to upper income households.” There are two key non-economic issues that will have an impact on consumer sentiment in the near term. One is the availability and efficacy of a vaccine. The other is the election (the survey was conducted before the presidential debate).
The opinions offered by Dr. Brown should be considered a part of your overall decision-making process. For more information about this report – to discuss how this outlook may affect your personal situation and/or to learn how this insight may be incorporated into your investment strategy – please contact your financial advisor or use the convenient Office Locator to find our office(s) nearest you today.
All expressions of opinion reflect the judgment of the Research Department of Raymond James & Associates (RJA) at this date and are subject to change. Information has been obtained from sources considered reliable, but we do not guarantee that the foregoing report is accurate or complete. Other departments of RJA may have information which is not available to the Research Department about companies mentioned in this report. RJA or its affiliates may execute transactions in the securities mentioned in this report which may not be consistent with the report’s conclusions. RJA may perform investment banking or other services for, or solicit investment banking business from, any company mentioned in this report. For institutional clients of the European Economic Area (EEA): This document (and any attachments or exhibits hereto) is intended only for EEA Institutional Clients or others to whom it may lawfully be submitted. There is no assurance that any of the trends mentioned will continue in the future. Past performance is not indicative of future results.
Markets & Investing Members of the Raymond James Investment Strategy Committee share their views on...
Markets & Investing Review the latest Weekly Headings by CIO Larry Adam. Key Takeaways ...
Technology & Innovation Learn about a few simple things you can do to protect your personal information...