December 18, 2020
Chief Economist Scott Brown discusses current economic conditions.
The holiday shopping season is critical for most retailers. For some, the season is make or break for the whole year. The November retail sales report was weaker than expected, although amplified by the seasonal adjustment. No surprise, consumers are increasingly shopping online. The pandemic has reduced the seasonal traffic at the brick-and-mortar stores. Seasonal adjustment issues are also evident in other areas, such as manufacturing and construction. In turn, much of the recent noise may see a reverse echo in January and February.
Retail sales fell 1.1% in November (+4.1% y/y). Motor vehicle sales fell 1.7% (+6.0% y/y), but fell 9.8% prior to seasonal adjustment (vs. -2.6% in November 2019). Sales at clothing stores fell 6.8% (up 4.8% before seasonal adjustment, compared to +17.7% in November 2019). Department store sales fell 7.7% (up +14.7% before adjustment, compared to +28.2% in November 2019). People have been shopping for Christmas, just not as much as usual. Is online shopping making up the difference? Sales at non-store retailers (including mail order and internet) edged up just 0.2% in November, but were up 13.9% before adjustment (up 29.3% y/y, compared to +8.9% y/y in November 2019). The pandemic accelerated two retail trends that have been apparent in recent years: the rise of internet shopping and ongoing weakness in brick-and-mortar retailing.

Motor vehicle production exhibits a strong seasonal pattern. Output falls sharply each July, due to the summer factory retooling shutdowns (a few decades ago, these were spread out over the summer, but they have become increasingly concentrated in the first week in July). Output also dips in November and December, reflecting the holidays. Motor vehicle output rose 5.3% in November, but was down 6.2% before seasonal adjustment. Vehicle production was unchanged from a year earlier. Note that while consumer demand for vehicles has been strong, business demand (including car rental agencies) has remained soft.
Seasonal adjustment can exaggerate minor quirks in the economic data. That is likely to be the case for the December employment figures (due January 8). While we may see further hiring in delivery services, retail hiring is likely to be softer than normal. We normally lose education jobs in December, but with less hiring in previous months, we ought to see fewer let go this December. Similarly, if you didn’t hire as many people in retail as you usually do in November and December, there will be fewer seasonal layoffs in January. A lot of this noise should balance out over time, leaving a slower trend in job growth in the near term. Job growth should pick up as vaccines are distributed.
The Fed’s Summary of Economic Projections showed that officials were less pessimistic about GDP growth in 2020, but the outlook for short- term interest rates was little changed. Most Fed officials expect the federal funds target rate to remain near 0% through 2023. The Fed is likely to alter the monthly pace of asset purchases in 2021, but that will depend on how fast the economy recovers, which in turn, will depend on how the current surge in COVID-19 cases plays out.
In the meantime, stay safe. Celebrate the holidays remotely if you can. We’ll see you in 2021.
The Fed’s Revised Summary of Economic Projections
The Fed’s revised projections were in line with the general view among private economists. While the economy is expected to have declined less in 2020 than was projected in September (which was less bleak than the outlook from June), expectations of short-term interest rates were little changed. In the release, the Fed included assessments of risk and uncertainty. Most officials view the level of uncertainty in the outlook as high. Risks to the growth outlook remain skewed to the downside, but much less than in September.
In the revised dot plot, most Fed officials (13 of 18) expect no change in short-term interest rates through 2023.

The Fed now expects real GDP to fall about 2.4% in 2020 (4Q/4Q), vs. a September forecast of -3.7% and a June forecast of -6.5%. GDP is seen rebounding 4.2% in 2021 (vs. September’s forecast of +4.0%), followed by 3.2% in 2022 (vs. +3.0%) and +2.4% in 2023 (vs. +2.5%).
The unemployment rate is expected to average 6.7% in 4Q20, vs. projections of 7.6% in September and 9.3% in June. Fed officials anticipate that the rate will drop to 5.0% in 4Q21 and 4.2% in 4Q22
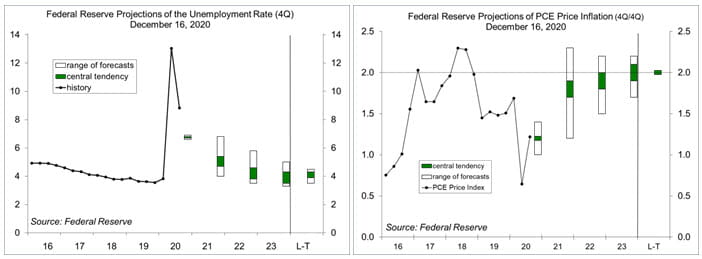
Despite the change in the Fed’s monetary policy framework, which allows for periods of inflation above 2% following periods below 2%, Fed officials expect inflation to remain below the 2% target. Fed officials expect the PCE Price Index, its key inflation gauge, to hit 1.2% this year (4Q/4Q), the same projection made in September, with core inflation at 1.4%.
Recent Economic Data
Retail sales fell 1.1% in November (+4.1% y/y), down 0.9% ex-autos (+3.6% y/y), reflecting the pandemic’s impact on holiday shopping. Sales at department stores fell 7.7% (+14.7% before adjustment, vs. +28.2% in November 2019). Sales at non-store retailers (includes internet and mail order) edged up 0.2%, but rose 29.2% from a year earlier, compared to +8.8% in the 12 months ending November 2019.
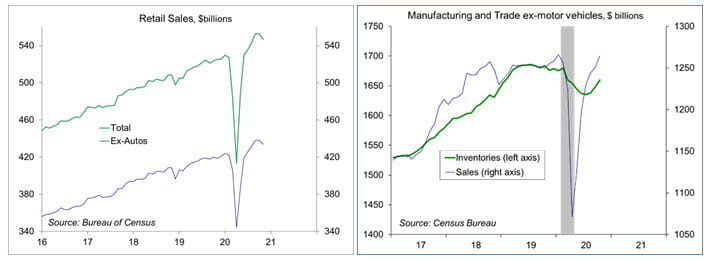
Business inventories rose 0.7% in October (-4.0% y/y). While this is just one month of the quarter, it’s likely that faster inventory accumulation will add to 4Q20 GDP growth. Business sales rose 0.9% (+2.2% y/y).
Industrial production rose 0.4% in November (-5.5%), with factory output up 0.8% (-3.5% y/y). Motor vehicle production rose 5.3%, following three monthly declines (prior to seasonal adjustment auto output fell 6.2% in November). Ex-motor vehicles, manufacturing output rose 0.4% (-3.9% y/y).

Building permits rose 6.2% in November, to a 1.639 million seasonally adjusted annual rate. Single-family permits, the key figure in the report, rose 1.3%, up 22.2% from a year ago. Note that single-family starts fell 16.1% before seasonal adjustment, vs. -20.0% in November 2019.
The current account deficit, the broadest measure of foreign trade, widened to $178.5 billion in 3Q20 (about 3.4% of GDP), compared to $104.3 billion (1.9% of GDP) in 4Q20.
Gauging the Recovery
The number of new daily COVID-19 cases has continued to surge. Increased social distancing, whether state mandated or voluntary self-preservation, should slow the pace (and the economy), but we are likely to see the surge get worse before it gets better.
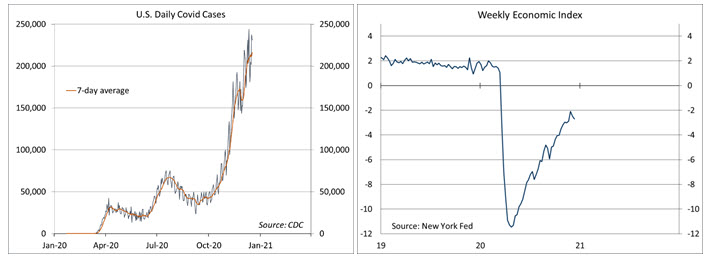
The New York Fed’s Weekly Economic Index fell to -2.70% for the week ending December 12, down from – 2.47% a week earlier (revised from -2.39%) and a low of -11.45% at the end of April, reflecting the increase in jobless claims and reduced electricity output. The WEI is scaled to four-quarter GDP growth (for example, if the WEI reads -2% and the current level of the WEI persists for an entire quarter, we would expect, on average, GDP that quarter to be 2% lower than a year previously). Note that the weekly figures are subject to revision.
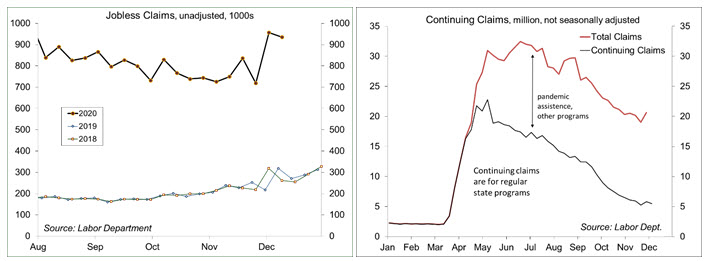
Jobless claims rose to 885,000 in the week ending December 12, up from the previous week’s jump to 862,000. Figures tend to be choppy in November and December, but the recent rise likely reflects the impact of the COVID-19 surge. Claims have been distorted throughout the pandemic, reflecting multiple filings and fraud. The total number of individuals receiving some kind of unemployment benefit was 20.6 million in the week ending November 28 (in the employment report, the number officially “unemployed” was 6.7 million).
The University of Michigan’s Consumer Sentiment Index rose to 81.4 in the mid-month assessment for December (the survey covered November 23 to December 9), vs. 76.9 in November and 81.8 in October. The survey noted partisan splits after the election. Expectations improved on vaccine news, but the current surge in COVID-19 cases had no significant impact on evaluations of current conditions.
The opinions offered by Dr. Brown are provided as of the date above and subject to change. For more information about this report – to discuss how this outlook may affect your personal situation and/or to learn how this insight may be incorporated into your investment strategy – please contact your financial advisor or use the convenient Office Locator to find our office(s) nearest you today.
This material is being provided for informational purposes only. Any information should not be deemed a recommendation to buy, hold or sell any security. Certain information has been obtained from third-party sources we consider reliable, but we do not guarantee that such information is accurate or complete. This report is not a complete description of the securities, markets, or developments referred to in this material and does not include all available data necessary for making an investment decision. Prior to making an investment decision, please consult with your financial advisor about your individual situation. Investing involves risk and you may incur a profit or loss regardless of strategy selected. There is no guarantee that the statements, opinions or forecasts provided herein will prove to be correct.
Markets & Investing Members of the Raymond James Investment Strategy Committee share their views on...
Markets & Investing Review the latest Weekly Headings by CIO Larry Adam. Key Takeaways ...
Technology & Innovation Learn about a few simple things you can do to protect your personal information...