Doug Drabik discusses fixed income market conditions and offers insight for bond investors.
When the media speaks of the yield curve, they are likely referring to the Treasury yield curve. It is the point of reference for interest rate levels and investment comparison. Although Treasuries may be a component of investment portfolios, it is often spread products that are the dominant fixed income holdings. Spread products are those securities that mostly trade at a margin or spread to the comparable Treasury security. For example, if the 10-year Treasury yields 4.59%, a corporate bond might trade at 4.59% plus a spread of 165 basis points or a yield of 6.24%. Treasury bonds are considered the highest credit quality or the least likely to default. Since spread products carry a higher risk than a Treasury bond,
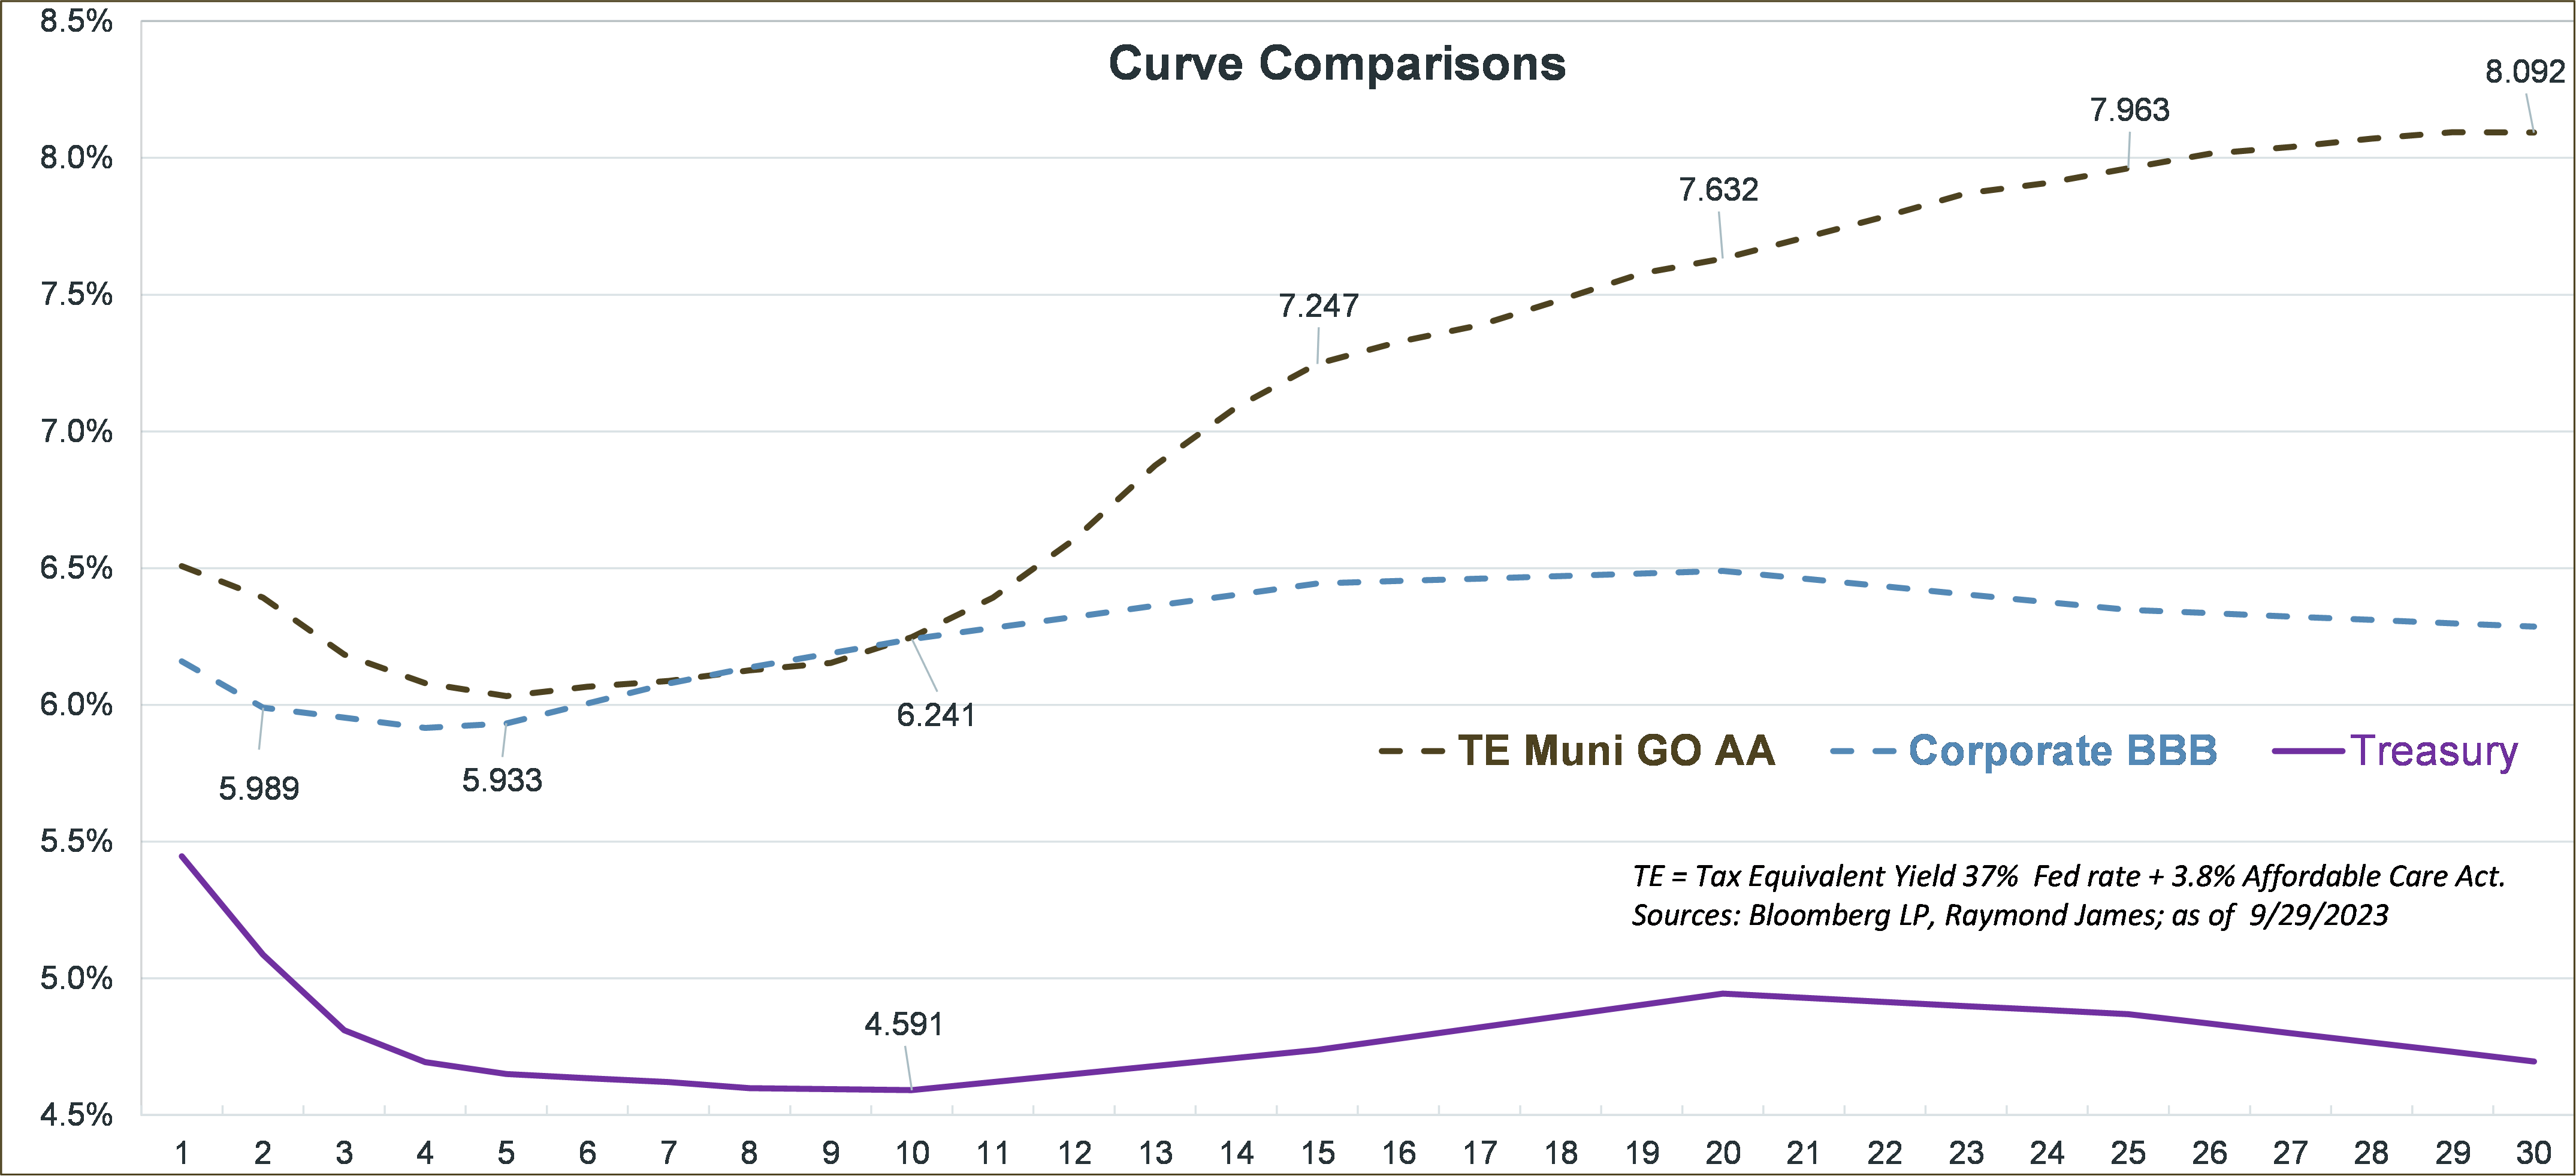
investors demand greater yields as compensation for taking on more risk. At Raymond James, most investors take on more risk than Treasury bonds possess, yet not a level of risk that keeps them from sleeping at night. Therefore, many investors maintain their fixed income allocations in high-quality, investment-grade bonds that maintain lesser degrees of credit risk to high-yield or junk investments yet can provide attractive yields.
For investors in the highest federal tax bracket (37%), tax-exempt municipal bonds provide the greatest benefits. Since the municipal curve is upward sloping, investors are rewarded on a grander scale further out on the curve. For investors in qualified accounts and/or those in lower federal tax brackets, corporate yields are elevated in the short and intermediate maturity ranges (1-10 years) and provide investors with attractive income opportunities within that range.
Is this a good time to shore up your portfolio’s fixed income allocation? There are two points of reference that
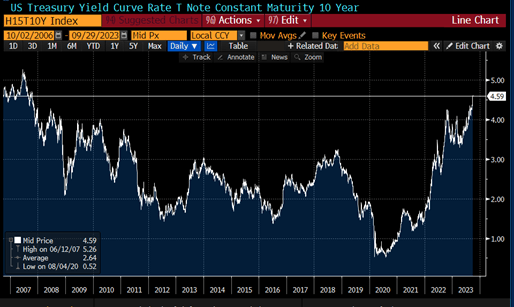
will help put this in perspective. First, rates are at levels that have not been seen in over 16 years. The graph reveals that August 16, 2007, or 16 years ago, is the last time we saw a 4.60% close on
Second, the average annual total return of the S&P Index since the turn of the century (nearly 23 years) is 6.62%. In other words, fixed income investments can provide 5.75% to 8.00%+ tax-equivalent yields over an extended period of time which mirror or even beat growth-like returns.
Pundits will argue over future rates, but it seems most are forecasting rates moving lower than higher from current levels. No one knows for sure. What we do know for certain is that we haven’t seen these rate levels in 16 years and that the current market mirrors long-term growth-like income. Don’t miss the opportunity that is right under your nose.
The author of this material is a Trader in the Fixed Income Department of Raymond James & Associates (RJA), and is not an Analyst. Any opinions expressed may differ from opinions expressed by other departments of RJA, including our Equity Research Department, and are subject to change without notice. The data and information contained herein was obtained from sources considered to be reliable, but RJA does not guarantee its accuracy and/or completeness. Neither the information nor any opinions expressed constitute a solicitation for the purchase or sale of any security referred to herein. This material may include analysis of sectors, securities and/or derivatives that RJA may have positions, long or short, held proprietarily. RJA or its affiliates may execute transactions which may not be consistent with the report’s conclusions. RJA may also have performed investment banking services for the issuers of such securities. Investors should discuss the risks inherent in bonds with their Raymond James Financial Advisor. Risks include, but are not limited to, changes in interest rates, liquidity, credit quality, volatility, and duration. Past performance is no assurance of future results.
Investment products are: not deposits, not FDIC/NCUA insured, not insured by any government agency, not bank guaranteed, subject to risk and may lose value.
To learn more about the risks and rewards of investing in fixed income, access the Financial Industry Regulatory Authority’s website at finra.org/investors/learn-to-invest/types-investments/bonds and the Municipal Securities Rulemaking Board’s (MSRB) Electronic Municipal Market Access System (EMMA) at emma.msrb.org.
Markets & Investing Members of the Raymond James Investment Strategy Committee share their views on...
Markets & Investing Review the latest Weekly Headings by CIO Larry Adam. Key Takeaways ...
Technology & Innovation Learn about a few simple things you can do to protect your personal information...