Read the weekly economic commentary from Chief Economist Scott Brown.
Nonfarm payrolls rose a bit more than expected in the initial estimate for March. While the monthly data are subject to statistical noise and seasonal adjustment difficulties, the underlying trend in job growth is likely moderating. That shouldn’t be a surprise. The job market is tight and firms continue to report difficulties in hiring new workers. Wage growth has trended higher, but not as much as one might expect with the unemployment rate at 3.8%. While a moderately strong report, details of the report were consistent with other mixed signs for the economy.
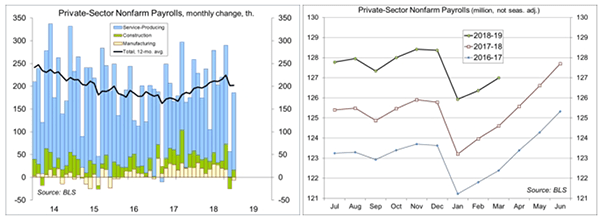
Prior to seasonal adjustment, nonfarm payrolls rose by 724,000 in March, a bit better than we saw a year ago (+703,000) and in March 2017 (+655,000). While not directly comparable to the establishment survey data, the household survey noted that 137,000 individuals could not get to work due to adverse weather during the survey week, vs. 159,000 a year ago and 164,000 in March 2017). In January, the weather was better than usual (adding to adjusted payroll growth), while February’s weather was worse than average (dampening the adjusted payroll gain). With those weather effects behind us, the March figures should, in theory, provide a clearer picture of the job market. Still, there is enough noise in the payroll data that it will take a couple more months of data to confirm whether job growth is returning to a more sustainable pace.
The employment report showed declines in manufacturing, retail, and temp-help payrolls in March. Softer global growth and trade policy uncertainty have been negative for U.S. exports. Investors typically focus on the monthly ISM factory sector survey, which reflected strength in March. However, manufacturing payrolls fell by 6,000, while factory hours held steady. Aggregate manufacturing hours slipped 0.1%, up just 0.5% from a year ago. Retail payrolls have traditionally been taken as a signal of consumer spending strength. Retail payrolls fell by 11,700 in March, following a 20,200 decline in February – and were 0.2% lower than a year ago. Some of the weakness in retail employment may reflect the ongoing shift to online sales. However, December’s 1.6% drop in retail sales and mediocre rebound remains a puzzle – and the weakness in retail payrolls in 2019 may signal that the household sector fundamentals are not as strong as we thought. Temp-help payrolls are often viewed as an early indicator of job growth. Many firms will hire temporary workers before adding to permanent workers, especially if there is concern about broader economic weakness (that is, talk of recession). However, the normal monthly noise means that recent softness in temp hiring is inconclusive.
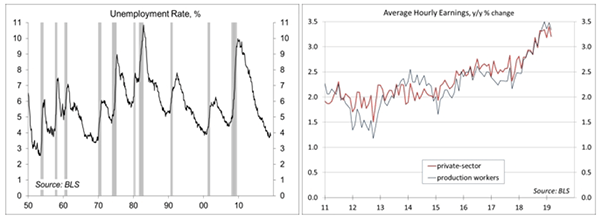
The unemployment rate held steady at 3.8% in March, down from 4.0% a year ago. The strong pace of growth in nonfarm payrolls over the last year (+1.7% y/y) implies that there was a lot more slack in the labor market than expected. However, the labor force participation rate and the employment/population ratio have been trending about flat. The establishment survey data and the household survey data have often given conflicting signals, but this seems to be a wide discrepancy.
Tighter labor market conditions imply faster wage growth. Average hourly earnings have increased at a faster pace, especially if one adjusted for inflation. However, this doesn’t seem to have translated into a sharp pickup in consumer spending growth. We saw similar disappointment in consumer spending growth following a pickup in real wage growth in 2015, as oil and gasoline prices tumbled. Part of that disappointment may have reflected the impact that lower oil prices had on employment in the energy sector and supporting industries. Consumers also faced higher shelter and healthcare costs in 2015. The weakness in holiday sales suggests that consumers may be facing similar kinds of strains currently, offsetting the overall impact of strong job gains and the pickup in wage growth. For March, the late Easter may have been a factor, although the retail sales figures are adjusted for floating holidays. Through March, tax returns are running a bit lower than a year ago, both in terms of the number of processed claims and the average refund per claim – however, that’s small potatoes compared to aggregate growth in income.
Firms continue to use a variety of policies to limit wage growth, such as offering more vacation and other perks or giving new employees signing bonuses instead of a higher starting salary. In general, firms continue to face pressure on earnings growth – so with the top line slowing, there’s an even greater desire to limit labor cost growth. Wage growth is not uniform across industries or employees. In general, higher wage growth should lead to a more efficient allocation of labor over time, but such transitions are rarely smooth.
Overall, the blemishes in the March employment report aren’t a disaster, but they are consistent with other mixed economic data reports. There’s nothing in the recent data that would begin to force the Fed’s hand one way or another. It’s also worth emphasizing that recent talk of an inverted yield curve and the possibility of a recession is not about current economic conditions – it’s about where the economy might be a year from now. One ought to expect mixed but moderate economic growth over the next several months, including a rebound in 2Q19 GDP growth (following what is expected to have been a relatively soft 1Q19).
Data Recap – The economic data reports were mixed, but generally consistent with moderate growth in the near term and steady monetary policy. Investors ignored the Brexit turmoil, but remained optimistic about the prospects for a U.S./China trade agreement. President Trump threatened to close the border with Mexico, but backed away.
The March Employment Report reflected a rebound from February’s weather, but suggested a more moderate trend in job growth than last year. Nonfarm payrolls rose by 196,000 in the initial estimate for March, with a net revision of +14,000 to the two previous months. Private-sector payrolls advanced by 182,000, leaving a 169,000 average gain for the first quarter (vs. +215,000 in 2018 and +172,000 in 2017). Manufacturing, retail, and temp-help each declined in March. Average hourly earnings, which are often a bit erratic, rose 0.1% (+3.2% y/y), up 0.3% for production workers (+3.4% y/y). The unemployment rate held steady at 3.8%, despite a slight dip in labor force participation.
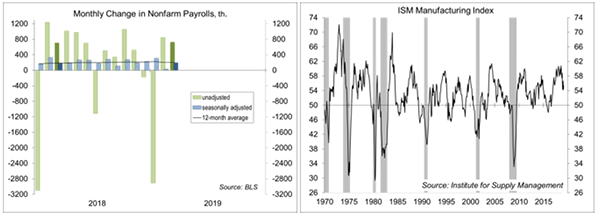
The ISM Manufacturing Index rose to 55.3 in March, vs. 54.2 in February and 56.6 in January. Growth in new orders, production, and employment picked up. Input price pressures edged higher, after a flat January and February. Comments from supply managers noted relative strength.
Retail Sales fell 0.2% in the advance estimate for February, vs. +0.7% in January (revised from +0.2%) and -1.6% in December, possibly restrained by unfavorable weather. Ex-autos, sales fell 0.4%, following a 1.4% gain in January (revised from +0.9%) and a 2.1% plunge in December. Ex-autos, building materials, and gasoline, sales fell 0.2%, vs. +1.4% in January and -1.8% in December.

Durable Goods Orders sank 1.6% in February, reflecting a 31.1% decline in civilian aircraft orders (this was before the Boeing crashes). Extransportation, orders edged up 0.1% (vs. -0.1% in January). Orders for nondefense capital goods ex-aircraft slipped 0.1%, down 1.4% since July.
The ISM Non-Manufacturing Index fell to 56.1 in March, vs. 59.7 in February. Business activity and new orders continued to advance, but more moderately than in February. Employment growth edged higher. Respondents were mostly optimistic about business conditions and the economy, but expressed concerns about labor market constraints.
The ADP Estimate of private-sector payrolls rose by 129,000 in the initial estimate for March (a 196,000 average for the first three months of the year). Job growth slowed across most industries and firm sizes.
Unit Motor Vehicle Sales rose to a 17.5 million seasonally adjusted annual rate in March (vs. a 16.5 million pace in February), likely reflecting clearance promotions following slower sales.
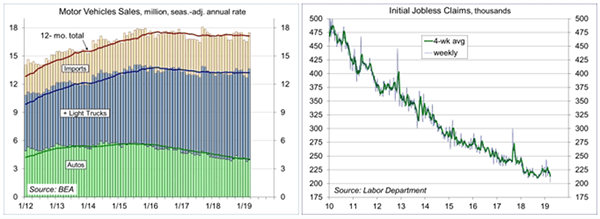
Initial Jobless Claims fell to 202,000 in the final week of March, the lowest level since December 6, 1969 (bear in mind that the labor force is twice as large now). The four-week average, at 213,500, is consistent with tight labor market conditions.
The ISM Manufacturing Index rose to 55.3 in March, vs. 54.2 in February and 56.6 in January. Growth in new orders, production, and employment picked up. Input price pressures edged higher, after a flat January and February. Comments from supply managers noted relative strength.
Retail Sales fell 0.2% in the advance estimate for February, vs. +0.7% in January (revised from +0.2%) and -1.6% in December, possibly restrained by unfavorable weather. Ex-autos, sales fell 0.4%, following a 1.4% gain in January (revised from +0.9%) and a 2.1% plunge in December. Ex-autos, building materials, and gasoline, sales fell 0.2%, vs. +1.4% in January and -1.8% in December.
The opinions offered by Dr. Brown should be considered a part of your overall decision-making process. For more information about this report – to discuss how this outlook may affect your personal situation and/or to learn how this insight may be incorporated into your investment strategy – please contact your financial advisor or use the convenient Office Locator to find our office(s) nearest you today.
All expressions of opinion reflect the judgment of the Research Department of Raymond James & Associates (RJA) at this date and are subject to change. Information has been obtained from sources considered reliable, but we do not guarantee that the foregoing report is accurate or complete. Other departments of RJA may have information which is not available to the Research Department about companies mentioned in this report. RJA or its affiliates may execute transactions in the securities mentioned in this report which may not be consistent with the report’s conclusions. RJA may perform investment banking or other services for, or solicit investment banking business from, any company mentioned in this report. For institutional clients of the European Economic Area (EEA): This document (and any attachments or exhibits hereto) is intended only for EEA Institutional Clients or others to whom it may lawfully be submitted. There is no assurance that any of the trends mentioned will continue in the future. Past performance is not indicative of future results.