Chief Economist Scott Brown discusses current economic conditions.
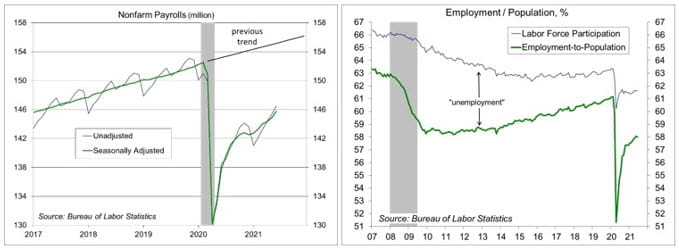
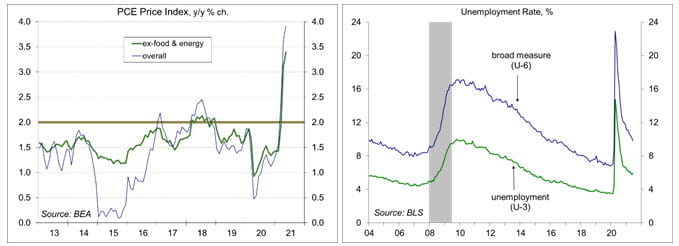
Nonfarm payrolls rose by 850,000 in the initial estimate for June, well above the median forecast of economists (+700,000), but boosted by a seasonal quirk in education (which added 268,000). The unemployment rate ticked up unexpectedly (to 5.9%), but that’s not unusual given the noise in the household survey data (the employment rate is reported accurate to ±0.2%). Average weekly hours fell, partly reflecting job gains in leisure and hospitality, which are often part-time. Still, we are a long way from seeing the “substantial improvement” that the Fed wants to see in the labor market.
Prior to seasonal adjustment, we lost 608,000 education jobs this June, whereas we would have expected to lose around 900,000 in a typical (pre- pandemic) June. Less hiring during the school year means fewer layoffs at the end of the school year. Ex-education, (adjusted) payrolls rose by 582,000 – in line with the pace of payroll growth for recent months. Prior to seasonal adjustment, we added 4.4 million jobs from February to June, vs. about 3.6 million for recent (pre-pandemic) years. That’s good, but we still have a lot of ground to make up. Nonfarm payrolls are still 6.8 million (5.3%) below the level of February 2020. We would have added roughly 2.6 million jobs if not for the pandemic, so we are about 9.4 million jobs below the pre-pandemic trend.
The unemployment rate edged higher in June. There is a fair amount of noise from month to month, but the overall trend is lower. Labor force participation (61.6% in June) has been roughly flat over the last several months, and well below the pre-pandemic level (63.3% in February 2020). One surprise, teen unemployment, while higher in June (9.9%, vs. 9.6% in May), is lower than before the pandemic (11.5% in February 2020 and a 12.7% average for 2019). Older workers are apparently balking at lower-paying, part-time jobs, leaving more space for younger workers.
Part-time employment increased in June, accounting for 15.4% of employment (according to the household survey). Most (69.2%) part-time jobs are voluntary (that is, taken by people who don’t want a full-time employment). The rest (30.8%) are working part-time because the employer is not offering full-time employment (which could be for economic reasons, such as insufficient demand). Leisure and hospitality (which includes restaurants) added 343,000 jobs in June (+718,000 before seasonal adjustment) and many of those are part-time. We added 194,000 restaurant jobs in June (+209,000 before seasonal adjustment). The increase in part-time employment reduced average weekly hours (34.7 in June, vs. 34.9 in April and 34.8 in May).
Matching millions of unemployed workers with millions of available jobs is challenging. Labor market frictions remain elevated, as one would expect. There is a lot going on under the surface. Contacts in states that have pulled back on federal unemployment benefits continue to report hiring difficulties. Unemployed workers are still being choosy. The quit rate is higher, as workers are confident about finding a better job elsewhere. Wages should be rising, but will likely be offset by higher inflation this year. While we are seeing good improvement, the job market is still far from where the Fed wants it to be.
Recent Economic Data
Nonfarm payrolls rose by 850,000 in the initial estimate for June, boosted by a quirk in education (which added 268,000), but generally strong. Leisure and hospitality added 343,000.
The unemployment rate edged up to 5.9% in June, vs. 5.8% in May. Labor force participation held steady at 61.6% (it was 63.3% before the pandemic). The employment/population ratio held steady at 58.0%, up from 54.6% a year ago, but well below the pre-pandemic level (61.1%).
The Chicago Business Barometer slipped to 66.1 (still extremely strong) in June, vs. 75.2 in May.
The ISM Manufacturing Index edged down to 60.6 in June, vs. 61.2 in May and 60.7 in April. New orders rose at a slightly slower pace (but still extremely strong). Production rose at a faster pace. Order backlogs continued to increase (although not as rapidly as in May). The employment gauge dipped to just below the breakeven level (essentially flat), reflecting difficulties in hiring. Supplier delivery times lengthened further, reflecting ongoing supply chain issues. Input price pressures rose further – the highest since July 1979 – with increases widespread across industries, covering “nearly all” raw and intermediate materials.
The Conference Board’s Consumer Confidence Index rose to 127.3 in June, vs. 120.0 in May and 87.1 back in January (it was 132.6 in February 2020 and fell to 85.7 in April 2020).
The Pending Home Sales Index jumped 8.0% in May (+1.9% before seasonal adjustment), up 13.1% y/y.
Gauging the Recovery
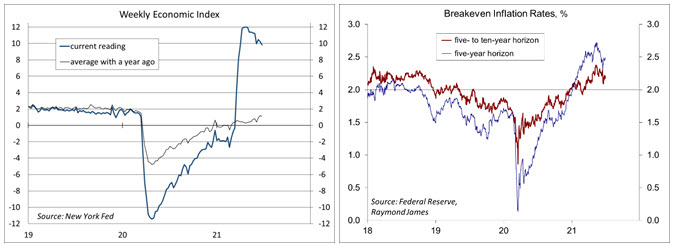
The New York Fed’s Weekly Economic Index edged down to +9.83% for the week ending June 26, vs. +10.22% a week earlier (revised from +9.96%), signifying strength relative to the depressed level of a year ago. The WEI is scaled to year-over-year GDP growth (GDP was down 9.0% y/y in 2Q20 and should be up y/y in 2Q21).
Breakeven inflation rates (the spread between inflation-adjusted and fixed-rate Treasuries, not quite the same as inflation expectations, but close enough) continue to suggest a moderately higher near-term inflation outlook. The 5- to 10-year outlook had crept above the Fed’s long-term goal of 2%, but has since moderated.
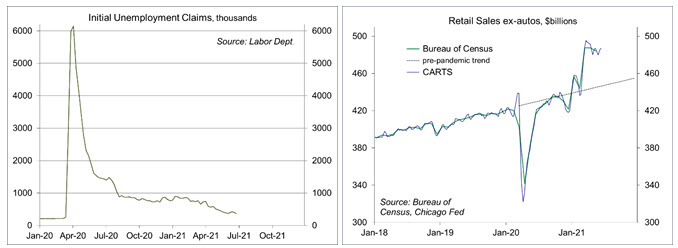
Jobless claims fell by 51,000, to 364,000 (a new pandemic low) in the week ending June 26. Claims figures are often subject to distortions at the end of the school year, but the trend is lower.
In the second week of June, the Chicago Fed Advance Retail Trade Summary (CARTS) data (based on multiple sources) showed a 0.2% increase in retail sales (ex-autos), following a 1.2% increase in the previous week. June sales are projected to rise 0.1% from May.
The University of Michigan’s Consumer Sentiment Index was 85.5 in the full-month assessment for June (the survey covered May 26 to June 21), vs. 86.4 at mid-month and 82.9 in May. The June increase was concentrated among households with incomes above $100,000. The report noted a decrease in inflation expectations, while consumers generally believe higher inflation will be transitory. Consumers also expressed concerns about COVID variants and will likely maintain precautionary funds rather than spend down household savings.
The opinions offered by Dr. Brown are provided as of the date above and subject to change. For more information about this report – to discuss how this outlook may affect your personal situation and/or to learn how this insight may be incorporated into your investment strategy – please contact your financial advisor or use the convenient Office Locator to find our office(s) nearest you today.
This material is being provided for informational purposes only. Any information should not be deemed a recommendation to buy, hold or sell any security. Certain information has been obtained from third-party sources we consider reliable, but we do not guarantee that such information is accurate or complete. This report is not a complete description of the securities, markets, or developments referred to in this material and does not include all available data necessary for making an investment decision. Prior to making an investment decision, please consult with your financial advisor about your individual situation. Investing involves risk and you may incur a profit or loss regardless of strategy selected. There is no guarantee that the statements, opinions or forecasts provided herein will prove to be correct.
Markets & Investing Members of the Raymond James Investment Strategy Committee share their views on...
Markets & Investing Review the latest Weekly Headings by CIO Larry Adam. Key Takeaways ...
Technology & Innovation Learn about a few simple things you can do to protect your personal information...


