Beau Snowden discusses fixed income market conditions and offers insight for bond investors.
Early in my career as a government bond trader, I remember clients owning 30 year Treasury bonds bought in the early 1980’s, yielding over 13%. When those bonds matured 30 year Treasury yields were around 2.90%. These investors looked like geniuses! Who in 1981 would dare buy a 30 year Treasury note when the Consumer Price Index in 1980 was 13.5% and the 2 year Treasury note yielded an all-time high of 16.95%? However, it was not genius as much as understanding economic cycles and knowing how to take advantage of those cycles.
Rising interest rate environments create opportunities for fixed income investors. The economy and interest rates are cyclical and taking advantage of market opportunities hinges on an understanding of this principle. The chart below is often used to demonstrate the cyclical nature of interest rates. It demonstrates how the yield curve moves during rising and declining interest rate environments. Notice that the 10 year part of the curve initially rises when the Fed begins raising the Fed Funds rate. Eventually, The 10 year and longer part of the curve settles into a narrow range while the 2 year and shorter part of the curve often continue to rise as the Fed raises short term interest rates, ultimately, flattening the curve.
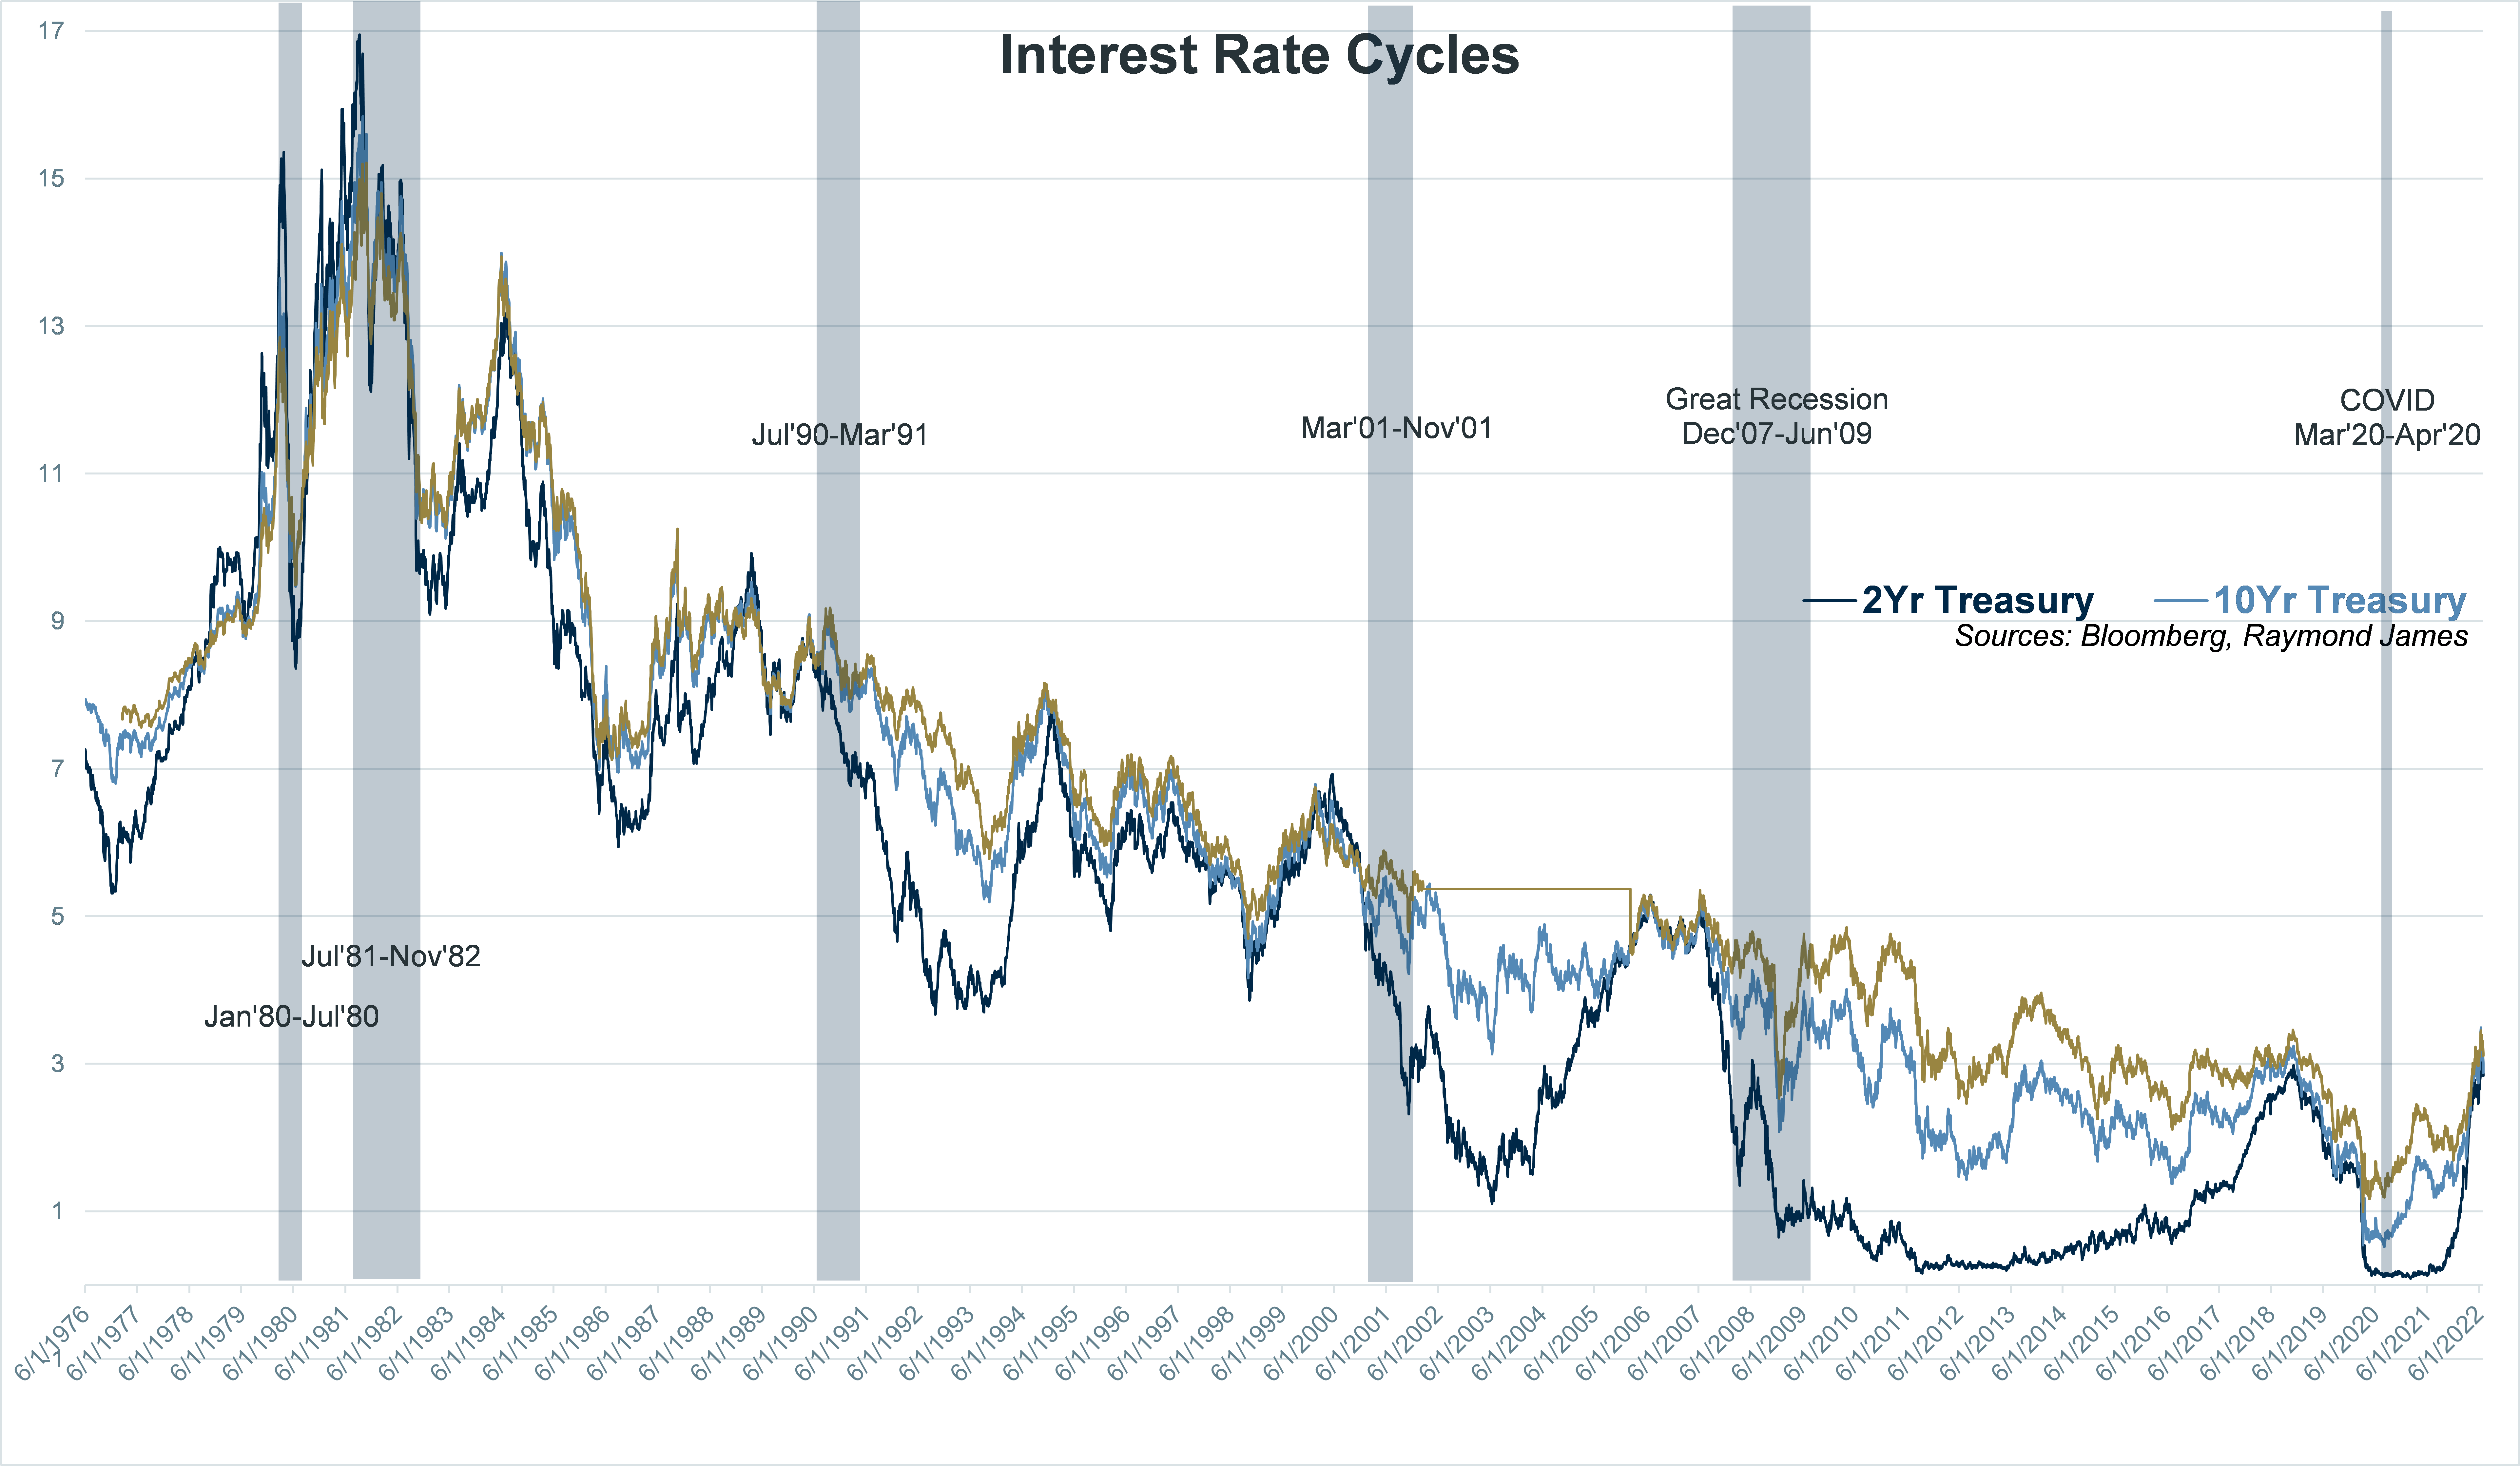
Every economic cycle tends to follow the same pattern; expansion, peak, contraction, and trough with interest rates following similar cycles of steepening yield curve, flattening, inversion and declining yields. Rinse and repeat. Year to date, the 10 year Treasury note low yield was on January 1 at 1.63%. It peaked on June 14 at 3.48% and is currently trading at 3.01%. The 2 year is currently yielding 2.78%, only a 2 basis point spread between the 2 and 10 year Treasury notes. The 10 year Treasury is trading ~2.80%, largely influenced by investors’ assessment of inflation. With only a 2bp spread between the 2 and 10 year notes, it may be telling us it’s time to lock in the yields.
In 1981 an investor could reasonably argue to stay short since the 2 year Treasury note was earning more than the 30 year Treasury bond. An investor could rationalize buying short maturities in anticipation that continued inflation would permit reinvesting into a higher interest rate environment. There was no guarantee that inflation would subside in 1981 just as there is no guarantee it will subside today. The uncertainty during this period is reflected in the graph’s volatile and confused movement. One could argue bond investors in 1981 would have benefitted from low durations.
Interest rates are nowhere near 1981 levels yet the story is much the same. It’s tempting to buy short maturities when the yield curve shows minor differences between the short term and longer term yields. Locking in today’s higher yields in longer maturities may make investors look like geniuses should interest rates begin to decline.
The author of this material is a Trader in the Fixed Income Department of Raymond James & Associates (RJA), and is not an Analyst. Any opinions expressed may differ from opinions expressed by other departments of RJA, including our Equity Research Department, and are subject to change without notice. The data and information contained herein was obtained from sources considered to be reliable, but RJA does not guarantee its accuracy and/or completeness. Neither the information nor any opinions expressed constitute a solicitation for the purchase or sale of any security referred to herein. This material may include analysis of sectors, securities and/or derivatives that RJA may have positions, long or short, held proprietarily. RJA or its affiliates may execute transactions which may not be consistent with the report’s conclusions. RJA may also have performed investment banking services for the issuers of such securities. Investors should discuss the risks inherent in bonds with their Raymond James Financial Advisor. Risks include, but are not limited to, changes in interest rates, liquidity, credit quality, volatility, and duration. Past performance is no assurance of future results.
Investment products are: not deposits, not FDIC/NCUA insured, not insured by any government agency, not bank guaranteed, subject to risk and may lose value.
To learn more about the risks and rewards of investing in fixed income, access the Securities Industry and Financial Markets Association’s Project Invested website and Investor Guides at www.projectinvested.com/category/investor-guides, FINRA’s Investor section of finra.org, and the Municipal Securities Rulemaking Board’s (MSRB) Electronic Municipal Market Access System (EMMA) at emma.msrb.org.
Markets & Investing Members of the Raymond James Investment Strategy Committee share their views on...
Markets & Investing Review the latest Weekly Headings by CIO Larry Adam. Key Takeaways ...
Technology & Innovation Learn about a few simple things you can do to protect your personal information...