Chief Economist Scott Brown discusses current economic conditions.
There were no significant surprises following the September 15-16 Federal Open Market Committee meeting. As expected, short-term interest rates were left unchanged and the FOMC did not alter its asset purchase plans. In the Summary of Economic Projections, Fed officials’ projections of growth, unemployment, and inflation were within the range of private-sector economic forecasters, showing a smaller hit to GDP this year, but somewhat slower growth in the next couple of years. The forecast horizon was extended, and most Fed officials (14 of 17) expect no change in rates through 2023. The FOMC incorporated its revised policy framework into the policy statement, but Powell was vague about how it will actually work.
Recall that the Fed’s revised policy framework altered how the Fed views its inflation and employment goals. The Fed has formally adopted a flexible average inflation targeting program. If inflation runs below 2% from some period, the Fed will try to achieve inflation above 2% for some time. The “flexible” qualifier means that there is no mathematical formula or rule. The Fed will use its judgment.
According to the FOMC policy statement: “The Committee seeks to achieve maximum employment and inflation at the rate of 2 percent over the longer run. With inflation running persistently below this longer-run goal, the Committee will aim to achieve inflation moderately above 2 percent for some time so that inflation averages 2 percent over time and longer-term inflation expectations remain well anchored at 2 percent. The Committee expects to maintain an accommodative stance of monetary policy until these outcomes are achieved.”
In his post-FOMC press conference, Chair Powell clarified that “with regard to interest rates, we now indicate that we expect it will be appropriate to maintain the current 0 to 1/4 percent target range for the federal funds rate until labor market conditions have reached levels consistent with the Committee’s assessments of maximum employment and inflation has risen to 2 percent and is on track to moderately exceed 2 percent for some time.”
What does Powell mean by “moderately exceed” and “some time?” This is where judgement comes in. According to Powell “moderate” means “not large” and “not very high above 2%.” “Some time” means “not permanently and not for a sustained period.” Got that? It’s as clear as the day is long.
While the Fed anticipates that it will guide inflation above 2% after a period of inflation below 2%, officials’ projections of inflation remain below 2% over the next three years. Powell indicated that “looking at everything we know about inflation dynamics in the United States and around the world over recent decades, we expect it will take some time.” As the economy recovers, the pace of improvement should slow. A big part of the economy will continue to struggle and “there will be slack in the economy.”
The main reason for the shift to flexible average inflation targeting is to convince financial market participants that 2% is a goal rather than a ceiling. If the market expects the Fed to raise rates every time inflation hits 2%, then inflation will average less than 2% over time. Actual inflation is driven by inflation expectations and the degree of slack in the economy. The shift in the framework is meant to drive expectations to 2%, from below 2%. Note that there had been a debate about moving the target above 2%, say to 3%, in order to give the Fed more leeway to cut during a downturn. That debate is settled for now as far as the Fed is concerned, but unlikely to go away in discussion outside the Fed.
The Fed’s employment goal is equally vague. Maximum employment is not something that can be reduced to a number the way inflation can,” said Powell, “it’s a broad range of factors.” He added, “That would certainly mean low unemployment, it would mean high labor force participation, it would mean wages, it would be a whole range of things, and we’re not looking at a rule.” The Fed is “looking at a judgmental assessment,” which Powell believes “we’ll be very transparent about as we go forward.”
As Powell noted when he unveiled the new framework in late August, low unemployment significantly benefits low- and mid- income communities
– and those communities have been hit hardest by the pandemic. As Powell noted, the Fed has lending powers not spending powers, and called for further action from Congress.
The Fed’s shift to a new policy framework has been more evolutionary than revolutionary. The Fed has effectively be operating this way for the last couple of years. The Fed’s revised long-term projections of inflation and unemployment suggest that the shift in the framework is subtle and not much may have changed in practice.
The Fed’s Revised Summary of Economic Projections
The Fed’s revised projections (now out to 2023) were in line with the general view of private economists. In the dot plot, most Fed officials (14 of 17) expect no change in short-term interest rates through 2023.
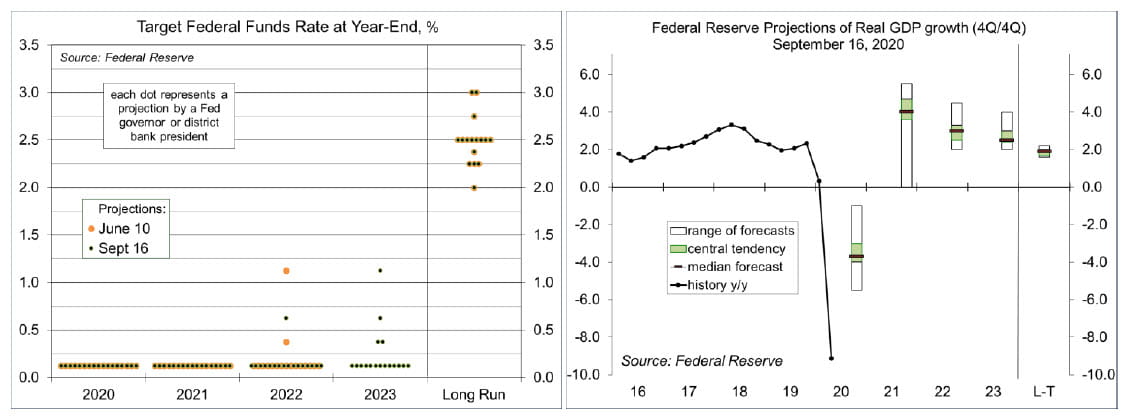
There is a lot of uncertainty in GDP forecasts, but the Fed sees a smaller decline this year (a quicker-but-partial recovery), which limits the upside for improvement in 2021 and 2022. The Fed expects real GDP to fall about 3.7% in 2020 (4Q/4Q), vs. a June forecast of -6.5%. GDP is seen rebounding 4.0% in 2021 (vs. June’s forecast of +5.0%), followed by a 3.0% in 2022 (vs. +3.5%).
In the Fed’s revised monetary policy framework, the central bank adopted a broad-based and inclusive employment goal. There is no specific target for the unemployment rate, but most officials expect a long-term equilibrium rate of around 4%. The unemployment rate is expected to average 7.6% in 4Q20 (vs. the June forecast of 9.3%), falling toward 4% by the end of 2023. Note that the unemployment rate is subject to distortions in the near term, as 8.1 million workers exited the labor force during in March April and 3.7 million have not returned (hence, not officially counted as “unemployed”).
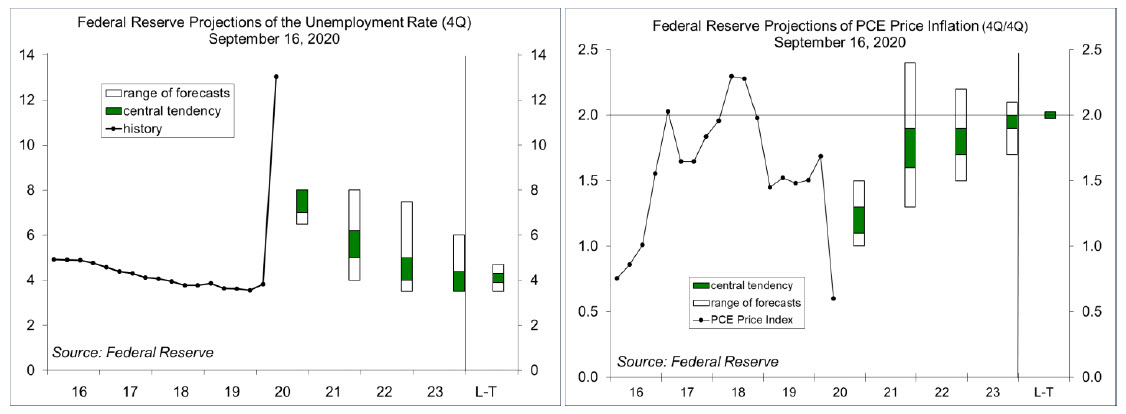
Despite the change in the Fed’s monetary policy framework, which allows for periods of inflation above 2% following periods below 2%, Fed officials expect inflation to remain below the 2% target. Fed officials expect the PCE Price Index, it key inflation gauge, to hit 1.2% this year (4Q/4Q), with core inflation at 1.5%.
Recent Economic Data
Retail sales rose 0.6% in August (+2.6% y/y), up 1.9% from February. Motor vehicle sales edged up 0.2% (+4.5% y/y). Ex-autos, sales rose 0.7% (+2.1% y/y). Core retail sales (which exclude autos, building materials, and gasoline) rose 0.5%, with mixed revisions to June and July. Department store sales fell 16.9% y/y and clothing sales fell 20.4% y/y, reflecting the pandemic’s impact on back-to-school sales. Non-store retail sales (including internet shopping) were flat in August (+22.4% y/y, compared to +15.7% y/y in August 2019). Sales at restaurants and bars rose 4.7% (-16.4% from February and down 15.4% y/y).
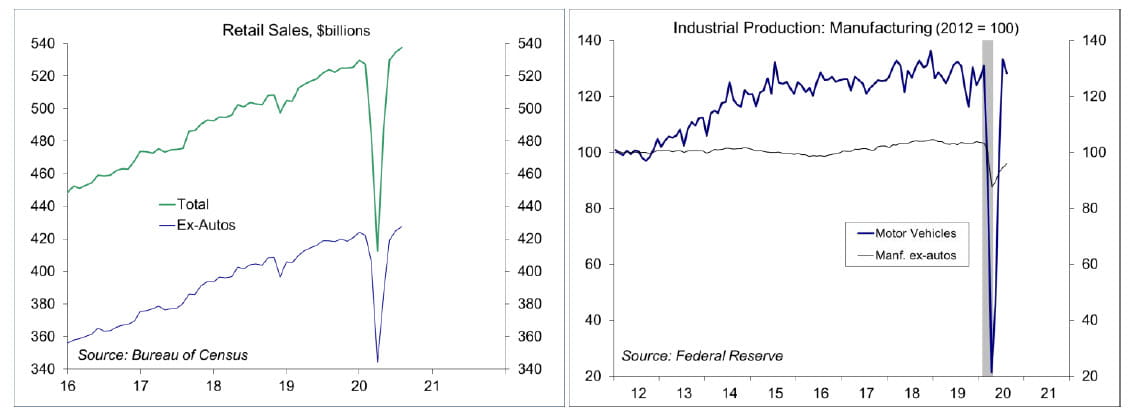
Industrial production rose 0.4% in August (-7.7% y/y), restrained by a 3.7% decline in motor vehicle production (vs. +31.7% in July). Vehicle output figures are subject to seasonal adjustment issues in July and August (reflecting seasonal plant closings, which were more limited this year, as auto companies sought to rebuild inventories). Ex-autos, factory output rose 1.4% (-7.3% y/y), stronger across industries (but showing generally more moderate improvement than in July) – down 7.0% from February.
Building permits fell 0.9% in August (-0.1% y/y), reflecting the usual volatility in the multi-family data. Single- family permits, the key figure in the report, rose 6.0% (+15.6% y/y), now 4.2% higher than in February (and February was strong). Housing starts were also mixed, with single-family starts up 4.1% (+12.1% y/y).
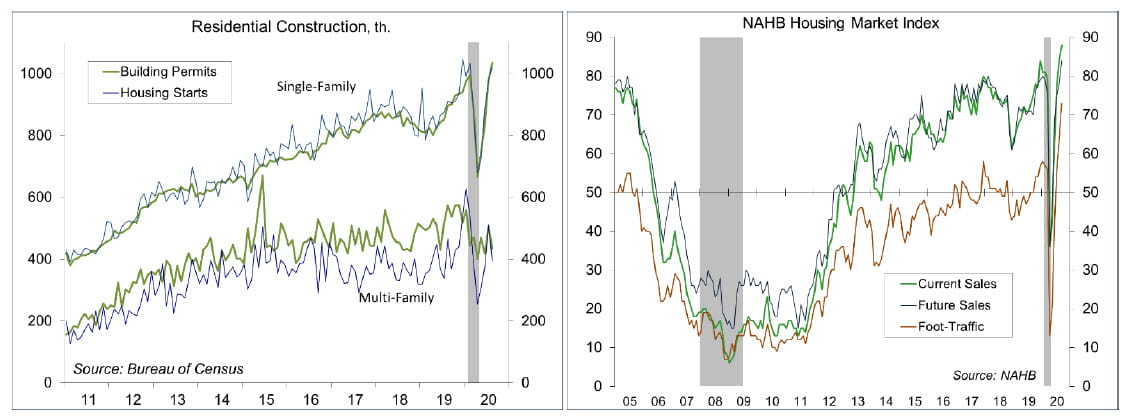
Homebuilder sentiment hit a record high in September. The National Association of Home Builder’s Housing Market Index rose to 83, vs. 78 in August and 72 in July. The index had dropped to 30 in April.
Gauging the Recovery
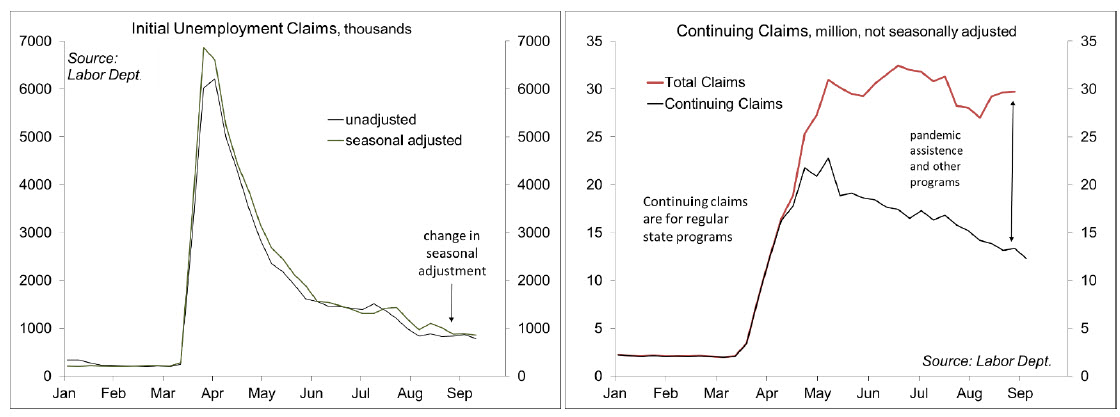
Jobless claims, a leading economic indicator, totaled 866,000 in the week ending September 12, the third week under the shift to additive seasonal adjustment. Figures are often noisy around major holidays, but the trend is still extremely high. Continuing claims (for regular state unemployment insurance programs), a coincident economic indicator, fell by 916,000 (week ending September 5) to 12.628 million. Total persons claiming UI benefits (all programs) rose by 98,000 in the week ending August 29 to 29.768 million (not seasonally adjusted) – However, that total appears to be overstated due to reporting issues and widespread fraud.
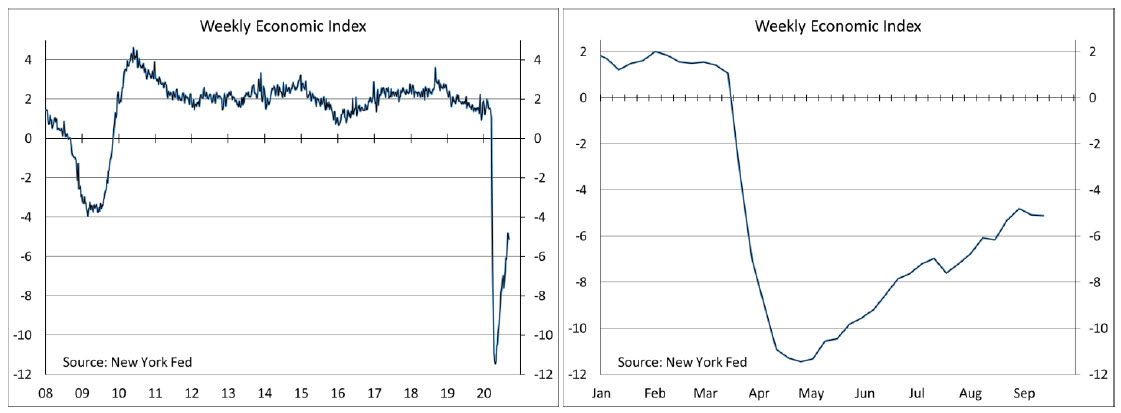
The New York Fed’s Weekly Economic Index fell to -5.11% for the week of September 12, down from -4.81% two weeks earlier and a low of -11.45% at the end of April, suggesting that the easy part of the recovery is behind us. The WEI is scaled to four-quarter GDP growth (for example, if the WEI reads -2% and the current level of the WEI persists for an entire quarter, we would expect, on average, GDP that quarter to be 2% lower than a year previously). Note that the weekly figures are subject to revision
The University of Michigan’s Consumer Sentiment Index rose to 78.9 in the mid-month assessment for September (the survey covered August 26 to September 14), vs. 74.1 in July. The report noted that “while the recent gain was consistent with an unchanged flat trend, the data indicated that the election has begun to have an impact on expectations about future economic prospects.” The September gains were primarily in the outlook for the economy, “and it was Democrats that posted gains in economic prospects while optimism about the economy weakened among Republicans.”
The opinions offered by Dr. Brown should be considered a part of your overall decision-making process. For more information about this report – to discuss how this outlook may affect your personal situation and/or to learn how this insight may be incorporated into your investment strategy – please contact your financial advisor or use the convenient Office Locator to find our office(s) nearest you today.
All expressions of opinion reflect the judgment of the Research Department of Raymond James & Associates (RJA) at this date and are subject to change. Information has been obtained from sources considered reliable, but we do not guarantee that the foregoing report is accurate or complete. Other departments of RJA may have information which is not available to the Research Department about companies mentioned in this report. RJA or its affiliates may execute transactions in the securities mentioned in this report which may not be consistent with the report’s conclusions. RJA may perform investment banking or other services for, or solicit investment banking business from, any company mentioned in this report. For institutional clients of the European Economic Area (EEA): This document (and any attachments or exhibits hereto) is intended only for EEA Institutional Clients or others to whom it may lawfully be submitted. There is no assurance that any of the trends mentioned will continue in the future. Past performance is not indicative of future results.
Markets & Investing Members of the Raymond James Investment Strategy Committee share their views on...
Markets & Investing Review the latest Weekly Headings by CIO Larry Adam. Key Takeaways ...
Technology & Innovation Learn about a few simple things you can do to protect your personal information...