Chief Economist Scott Brown discusses current economic conditions.
Recent economic data reports added to the picture of a sharp rebound in May and June, followed by more moderate growth in July, August, and September. Economic activity through the pandemic has been mixed, with strength in some areas and prolonged weakness in others. The rise in cases here and across the Atlantic raises concerns about the strength of the recovery into 2021.
Real GDP rose 7.4% (q/q) in the advance estimate for 2Q20, or +33.1% at an annual rate, down 3.5% from the end of last year. The rebound was led by improvement in consumer spending, up at a 40.7% annual rate (vs. -6.9% in 1Q20 and -33.2% in 2Q20), but 3.3% below the level of 4Q19. Spending on consumer durable goods (including motor vehicles, home furnishings, etc.) was 11.9% higher than in 4Q19, while spending on consumer services was down 7.7%. Business fixed investment rose at a 20.3% annual rate (vs. -6.7% in 1Q20 and -27.2% in 2Q20), still down 4.9% from the end of last year. Ongoing weakness was concentrated in business structures, down 14.0% from 4Q19. Residential fixed investment rose at a 59.3% annual rate in 3Q20 (following -9.0% in 1Q20 and -35.6% in 2Q20), up 5.1% from 4Q19.
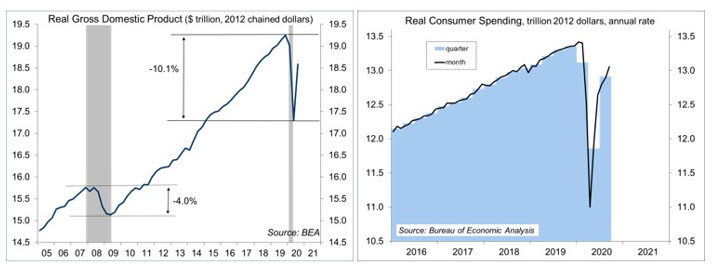
GDP arithmetic can seem quirky and unusual to people who haven’t been steeped in it for decades. Much of the weakness in the second quarter reflected sharp weakness in March and April. Strength in the third quarter mostly reflected gains in May and June. Yes, May and June were in the second quarter, but that’s the way the math works. Figures on consumer spending (70% of GDP) are available monthly. Amid extreme social distancing, spending fell 6.5% in March and 12.3% in April. It then rose 8.5% in May and 5.9% in June as restrictions were relaxed. Consumer spending then rose 3.2% over July, August, and September – still relatively strong by historical standards, but much more moderate than in May and June.
The key question is where we go from here. In the next couple of weeks we’ll get payroll data and retail sales figures for October, which should show further improvement. The rise in COVID-19 cases raises concerns that spending growth may be more restrained. Note that regardless of state and local government directives, increased social distancing may be more voluntary. One of the main worries in the early part of the pandemic was that the economy might open up too rapidly, leading to higher cases. In response, increased social distancing would lead to reduced cases and an eventual re-opening – and a prolonged cycling over time. Depending on the definition, we are in a third wave.
It seems unlikely that we would return to a full lockdown and another contraction in GDP. Consumers and businesses have gotten used to living under a pandemic, even if they have to show greater observance. However, another socially distancing induced contraction in economic activity is not out of the question and the economic impact can be expected to be more severe in some areas of the country. Wear your mask. Wash your hands. Use common sense.
Recent Economic Data
Personal income rose 0.9% in September (+6.2% y/y), with mixed social assistance (unemployment insurance down, support to small business higher). Private-sector wage and salaries rose 1.0% (+0.8% y/y), still 3.0% lower than in February. Consumer spending rose 1.4% (-0.6% y/y), up 1.2% adjusting for inflation (-2.0% y/y).
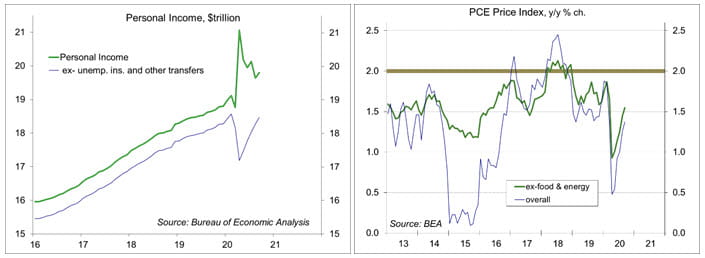
The PCE Price Index rose 0.2% in September (+1.4% y/y). Excluding food & energy, the PCE Price Index rose 0.2% (+1.5% y/y) – still trending below the Fed’s 2% goal.
While gains in consumer spending were broad-based across sectors from April to September, some areas were stronger than others. Spending on consumer durable goods was significantly higher in September than in February. Spending on clothing, gasoline, and consumer services, while higher in recent months, remained weak. Consumer services aren’t expected to recover fully until the pandemic is well behind us.
|
$billion (annual rate) |
Feb-Apr |
% |
Apr-Sep |
% |
Feb-Sep |
% |
|
Personal consumption expenditures |
-2765.3 |
-18.6 |
2466.3 |
20.4 |
-299.0 |
-2.0 |
|
Goods |
-677.4 |
-14.8 |
1030.4 |
26.5 |
353.0 |
7.7 |
|
Durable goods |
-352.9 |
-22.7 |
592.9 |
49.4 |
240.1 |
15.5 |
|
Motor vehicles and parts |
-146.3 |
-28.4 |
253.4 |
68.9 |
107.1 |
20.8 |
|
Furnishings and durable household equip |
-73.2 |
-19.9 |
112.0 |
38.0 |
38.8 |
10.5 |
|
Recreational goods and vehicles |
-42.9 |
-9.6 |
120.5 |
29.7 |
77.5 |
17.3 |
|
Other durable goods |
-90.5 |
-40.7 |
107.1 |
81.1 |
16.6 |
7.5 |
|
Nondurable goods |
-324.5 |
-10.8 |
437.5 |
16.3 |
113.0 |
3.7 |
|
Food/bev for off-premises consumption |
81.9 |
7.9 |
23.4 |
2.1 |
105.3 |
10.2 |
|
Clothing and footwear |
-195.7 |
-48.3 |
179.6 |
85.9 |
-16.1 |
-4.0 |
|
Gasoline and other energy goods |
-174.9 |
-52.6 |
97.8 |
62.1 |
-77.1 |
-23.2 |
|
Other nondurable goods |
-35.8 |
-2.9 |
136.6 |
11.3 |
100.8 |
8.1 |
|
Services |
-2087.9 |
-20.3 |
1435.9 |
17.5 |
-652.1 |
-6.3 |
|
Household cons. exp. (for services) |
-2340.1 |
-23.8 |
1693.3 |
22.6 |
-646.9 |
-6.6 |
|
Housing and utilities |
31.5 |
1.1 |
30.5 |
1.1 |
62.0 |
2.3 |
|
Health care |
-883.0 |
-34.7 |
764.2 |
46.1 |
-118.8 |
-4.7 |
|
Transportation services |
-261.2 |
-52.1 |
130.5 |
54.4 |
-130.8 |
-26.1 |
|
Recreation services |
-360.5 |
-61.0 |
197.5 |
85.7 |
-163.0 |
-27.6 |
|
Food services and accommodations |
-540.2 |
-53.0 |
373.8 |
78.1 |
-166.4 |
-16.3 |
|
Financial services and insurance |
-28.4 |
-2.4 |
47.8 |
4.1 |
19.4 |
1.6 |
|
Other services |
-298.4 |
-23.9 |
149.0 |
15.7 |
-149.4 |
-12.0 |
Source: Bureau of Economic Analysis
New home sales fell 3.5% in the initial estimate for September (reported accurate to ±19.9%), up 32.1% from a year ago. These figures are erratic, but generally consistent with housing strength.
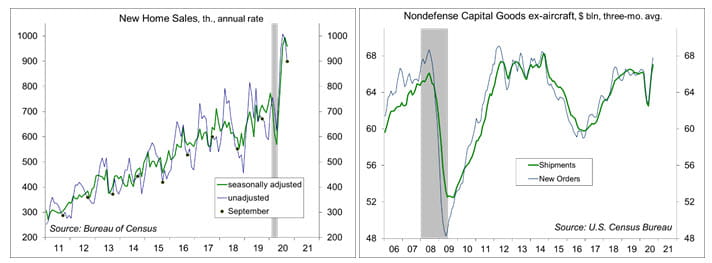
Durable goods orders rose 1.9% in September (-10.1% year-to-date), reflecting a pickup in civilian aircraft orders. Transportation orders rose 4.1% (motor vehicles +1.5%, civilian aircraft orders at +$1.8 billion vs. –
$19.7 billion over the three previous months, defense aircraft fell 46.1%). Ex-transportation, orders rose 0.8% (down 2.2% year-to-date). Orders for nondefense capital goods ex-aircraft rose 1.0% (-0.5% year-to date).
The Employment Cost Index rose 0.5% over the three months ending in September, up 2.4% from a year earlier (vs. +2.8% y/y in September 2019). Unlike average weekly earnings, which are influenced by the changing composition of employment (for example, large job losses in lower-paying industries), the ECI keeps the mix of jobs constant, and more importantly, includes benefits costs (which account for about 30% of compensation). Labor costs still need to be adjusted for productivity gains to gauge the inflationary impact, but labor cost pressures have continued to trend at a moderate pace.
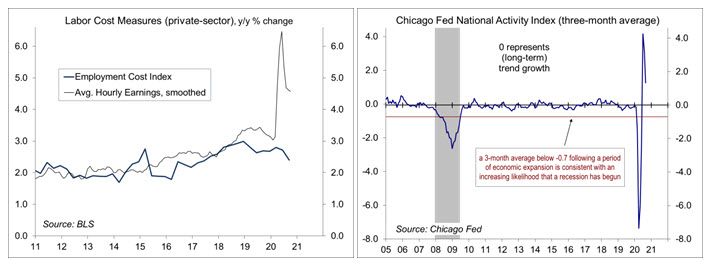
The Chicago Fed’s National Activity Index, a composite of 85 economic indicators, fell to +0.27 in September, from +1.11 in August and +2.61 in July. At +1.33, the three-month average was consistent with more moderate economic growth in the near term.
Gauging the Recovery
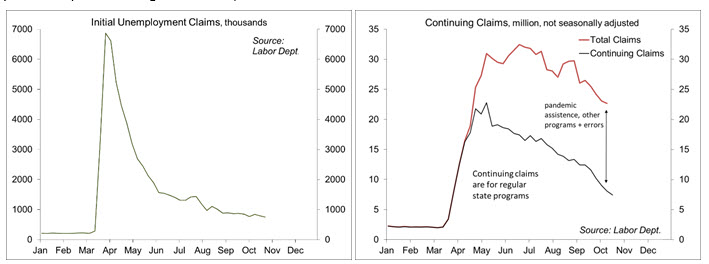
Jobless claims, a leading economic indicator, fell to 751,000 in the week ending October 24. The four-week average was 787,750 – still an extremely high trend (although less horrific than in March and April). Continuing claims (for regular state unemployment insurance programs), a coincident economic indicator, fell by 709,000 (week ending October 18) to 7,756,000.
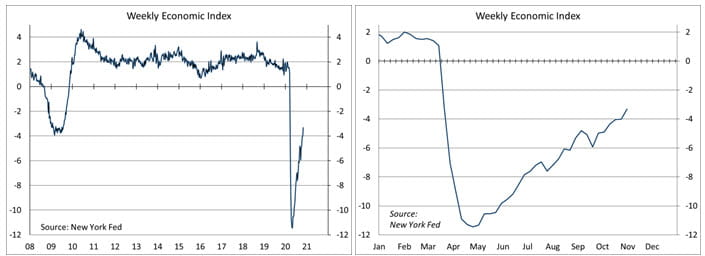
The New York Fed’s Weekly Economic Index rose to -3.32% for the week of October 24, up from -4.01% a week earlier (revised from -3.80%) and a low of -11.45% at the end of April, consistent with a moderation in the pace of the recovery. The WEI is scaled to four-quarter GDP growth (for example, if the WEI reads -2% and the current level of the WEI persists for an entire quarter, we would expect, on average, GDP that quarter to be 2% lower than a year previously). Note that the weekly figures are subject to revision
The University of Michigan’s Consumer Sentiment Index was little changed at 81.8 in the full-month assessment for October (the survey covered September 30 to October 28), vs. 81.2 at mid-month and 80.4 in September. The report noted that shifts in political perceptions had offsetting impacts over the last few months (“compared with three months ago, the Expectations Index rose by 50% among Democrats but just 7% among Republicans”).
The opinions offered by Dr. Brown should be considered a part of your overall decision-making process. For more information about this report – to discuss how this outlook may affect your personal situation and/or to learn how this insight may be incorporated into your investment strategy – please contact your financial advisor or use the convenient Office Locator to find our office(s) nearest you today.
All expressions of opinion reflect the judgment of the Research Department of Raymond James & Associates (RJA) at this date and are subject to change. Information has been obtained from sources considered reliable, but we do not guarantee that the foregoing report is accurate or complete. Other departments of RJA may have information which is not available to the Research Department about companies mentioned in this report. RJA or its affiliates may execute transactions in the securities mentioned in this report which may not be consistent with the report’s conclusions. RJA may perform investment banking or other services for, or solicit investment banking business from, any company mentioned in this report. For institutional clients of the European Economic Area (EEA): This document (and any attachments or exhibits hereto) is intended only for EEA Institutional Clients or others to whom it may lawfully be submitted. There is no assurance that any of the trends mentioned will continue in the future. Past performance is not indicative of future results.
Markets & Investing Members of the Raymond James Investment Strategy Committee share their views on...
Markets & Investing Review the latest Weekly Headings by CIO Larry Adam. Key Takeaways ...
Technology & Innovation Learn about a few simple things you can do to protect your personal information...