Read the weekly economic commentary from Chief Economist Scott Brown.
Tariffs have had a negative impact on the U.S. economy, but a relatively limited one to date. Pain is obviously felt more in some areas than others, but the cumulative impact is growing and a continued escalation in trade tensions would further dampen growth. The fallout of the trade war does not appear to be enough, by itself, to push the U.S. into a recession, but it’s not helping.
A full timeline of Trump’s trade war can be found here. We can look at the trade war with China as having three broad phases. The first round was 25% tariffs on $50 billion in Chinese goods, mostly intermediate inputs and capital equipment. The second phase was a 10% tariff on $200 billion in Chinese goods, mostly capital goods and some consumer goods (including mobile phones, laptops, and clothing) – which was raised to 25% on May 10. Trump has also threatened a third phase, which would impose 25% tariffs on the remaining $300 billion or so of Chinese imports, which would be mostly consumer goods. The third phase would have a more significant impact on consumer spending (retail margins are generally low, leaving firms with less ability to absorb price increases).
Tariffs are a tax, but one paid by the U.S. importer, not China, and passed along in higher prices to U.S. consumers and businesses. Tariffs raise costs, disrupt supply chains, invite retaliation, and raise the level of uncertainty in capital spending decisions. Anecdotal evidence suggests increased strains for U.S. manufacturers that use Chinese parts and supplies. Retaliation has harmed farmers and firms exporting machinery and equipment. It’s estimated that the cumulative impact of tariffs, including the possible third phase, would be to shave about half of a percent from GDP growth this year, although that doesn’t include possible multiplier effects – still, not enough, by themselves, to push the U.S. economy into a recession.
It appears that expectations of higher tariffs pulled forward imports in 2018, widening the trade deficit and boosting the pace of inventory accumulation. In 1Q19, we saw a correction. Imports, which have a negative sign in the GDP calculation, fell back. Net exports added a full percentage point to first quarter growth. That doesn’t mean that “trade policy is lifting growth.”
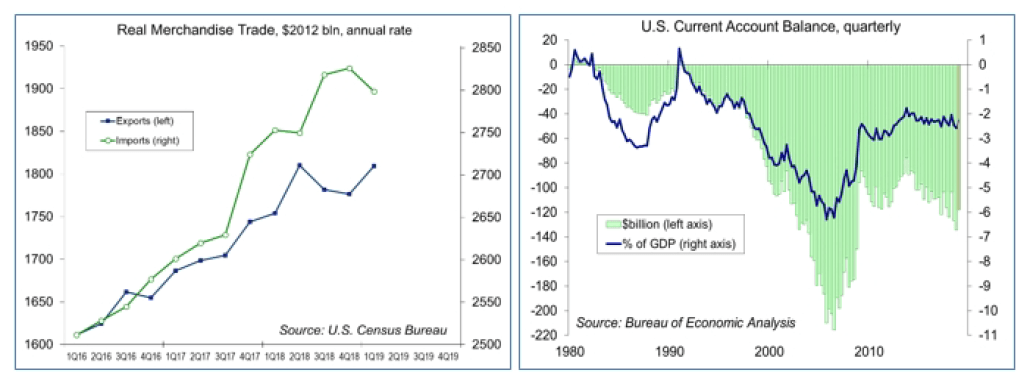
The current account deficit, the broadest measure of U.S. foreign trade, should have narrowed in the first quarter (the figures will be released on June 20). However, the current account deficit is trending at 2.0-2.5% of GDP, not particularly high by historical standards (in comparison, we saw it reach more than 6% of GDP in 2005). Why does the U.S. run large trade deficits? It’s not because of bad trade deals. We consume more than we produce, or in other words, we don’t save enough – and remember, the federal budget deficit (nearing $1 trillion per year) is part of national savings.
In aggregate, countries stand to gain through trading with each other. In trading with China, we aren’t getting ripped off. We are getting a lot of cheap stuff. However, while there are clear benefits to free trade, there are also negatives. Increased trade with other countries can displace workers, often with devastating consequences for households and communities. The increase in trade with China since 2000 has had a significant impact on manufacturing employment (although about half of the manufacturing job losses were due to technology). As a country, we’ve failed those displaced workers. The damage done has led to resentment.
While tariffs have imposed pain on the U.S. manufacturing sector, many (if not most) in the industry still support Trump’s policies. The view is that some short-term pain is worth a better long-term outcome. However, the pain can be endured only for so long. A “better” trade deal doesn’t mean much if you’re out of business. Moreover, there’s no guarantee that a revised trade agreement will lead to a much different outcome. Again, the driving force behind the trade deficit is the fact that the U.S. doesn’t save enough.
Traditionally, one way to reduce the trade deficit is to have a recession. In the past, global economic cycles were often out of phase, facilitating trade rebalancing. However, we’re all mostly on the same page now. The U.S. and Chinese economies are tied together, for better or worse.
Since China exports a lot more to the U.S. than we export to China, the trade war should have a greater impact on the Chinese economy than on the U.S. economy. But while the drag on Chinese growth is larger, the underlying trend rate of growth is a lot higher in China. While trade policy has been a concern for the Chinese economy, the country’s troubles are more widespread. Fiscal and monetary policy stimulus should help to propel the Chinese economy along, but growth in the country looks a lot different over the last 10 years than in previous decades. Twenty or thirty years ago, Chinese growth (10-12% per year) was fueled by infrastructure spending and growth in exports. In the last ten years, debt has played a much bigger role and the country has shifted away from private enterprise to state-owned enterprise, leaving the economy on a less firm foundation as growth slows to 6%.
Will China dump its holdings of Treasury securities in retaliation? We’ve been here before. In the late 1980s, the fear was that Japan would sell its holdings of Treasuries, but there was no incentive for them to do so. The same logic applies now with China. All else equal, selling Treasuries would boost China’s currency, which is not what you want to do during a trade war.
For the Fed, tariffs don’t appear to have had a broad impact on overall inflation, although the possible third phase of tariffs against China would have some short-term implications. As we’ve seen with oil prices, higher input prices are likely to result in softer spending growth than in a higher underlying trend in inflation. The Fed can be expected to stand pat for now, but we should begin to see some internal debate, especially as the recent trend in core inflation has remained low and key indicators (retail sales, industrial production) have been soft.
Data Recap – The two key reports, retail sales and industrial production, were disappointing. Combined with mild inflation readings and concerns about the negative impact of tariffs, the federal funds futures priced in a greater chance of a Fed rate cut by the end of the year. Stock market participants were more focused on the prospects for a trade deal with China, and the bond market reacted largely to what was happening to stocks.
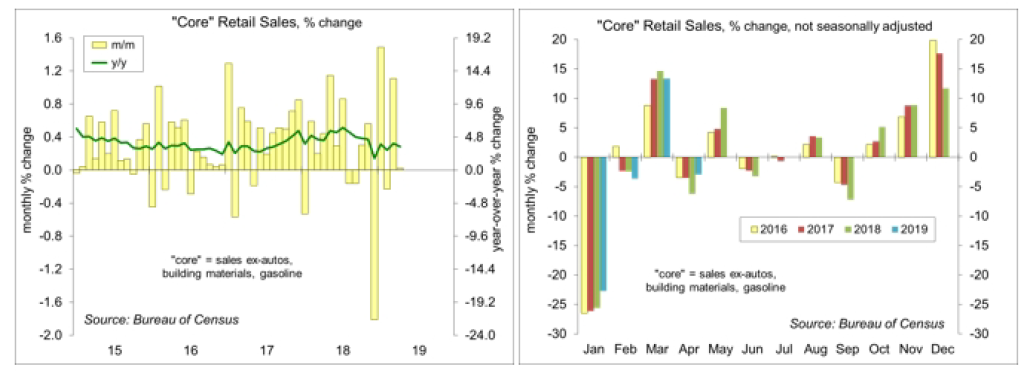
Retail Sales fell 0.2% in the advance estimate for April (+3.1% y/y), up 0.1% ex-autos (+3.3% y/y). Auto sales fell 1.1% (+2.2% y/y), consistent with the unit sales figures reported by the various manufacturers. Gasoline sales rose 1.8% (+4.9% y/y) on higher prices (the CPI for gasoline rose 5.7%). Ex-autos, building materials, and gasoline, sales were unchanged (+3.4% y/y), following a 1.1% gain in March).
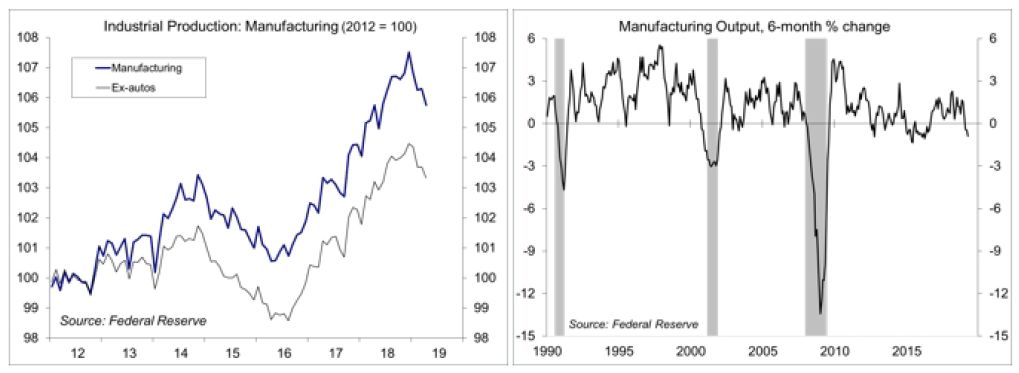
Industrial Production fell 0.5% in April (+0.9% y/y). Manufacturing output fell 0.5% (0.0% y/y), with motor vehicle production down 2.6% (-4.4% y/y). Ex-autos, factory output slipped 0.3% (+0.1% y/y). The output of utilities fell 3.5% (-4.7% y/y) on warmer temperatures. Mining rose 1.6% (+10.4%) with oil and gas extraction up 1.4% (+13.5% y/y). Oil and gas well drilling fell 1.3% (+3.1% y/y).
Homebuilder Sentiment rose to 66 in May, vs. 63 in April.
Building Permits rose 0.6% in April to a 1.296 million seasonally adjusted annual rate (-5.0% y/y), reflecting the usual volatility in the multi-family data. Single-family permits, the key figure in the report, fell 4.2% (-9.4%). Unadjusted single-family permits for February-April fell 7.1% y/y (-0.8% in the Northeast, -11.4% in the Midwest, -4.3% in the South, and -12.2% in the West). Housing Starts rose 5.7% (±13.0%), to a 1.235 million pace (-2.5% y/y).
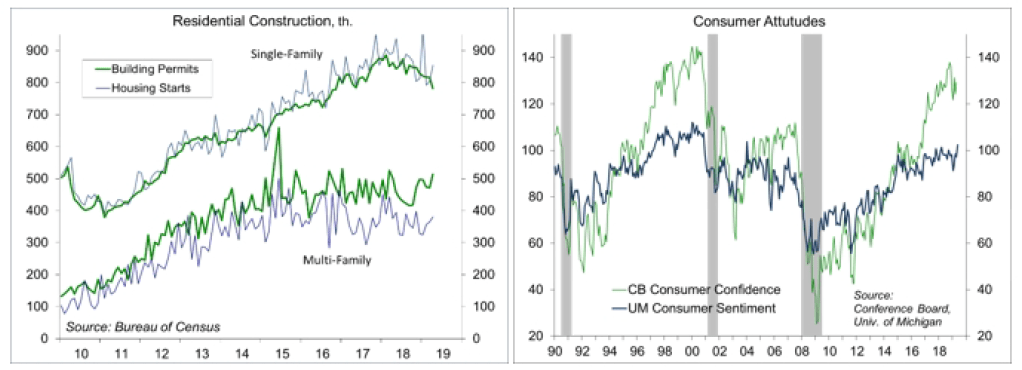
The University of Michigan’s Consumer Sentiment Index rose to 102.4 in the mid-May estimate (a 15-year high), vs. 97.2 in April. Improvement was concentrated in expectations, which are thought to be a factor in big-ticket purchase decisions. However, the survey failed to capture much of the recent increase in trade tensions, which has had a “corrosive” impact on consumer attitude measures in the past.
The Index of Leading Economic Indicators rose 0.2% in April, as expected (most of the components are known and it’s a published formula). Positive contributions were led by the stock market and credit. The drop in ISM new orders was the only significant negative contribution. The six-month growth rate in the LEI has slowed over the last several months, suggesting that while the economic expansion should continue, it’s unlikely to accelerate in the near term.
The Consumer Price Index rose 0.3% in April (+2.0% y/y), up 0.1% ex-food & energy (+2.1% y/y). Gasoline (3.9% of the overall CPI) rose 5.7% (+10.3% before seasonal adjustment, and +3.1% y/y). Apparel prices fell 0.8%, following a 1.9% plunge in March (-3.0% y/y).
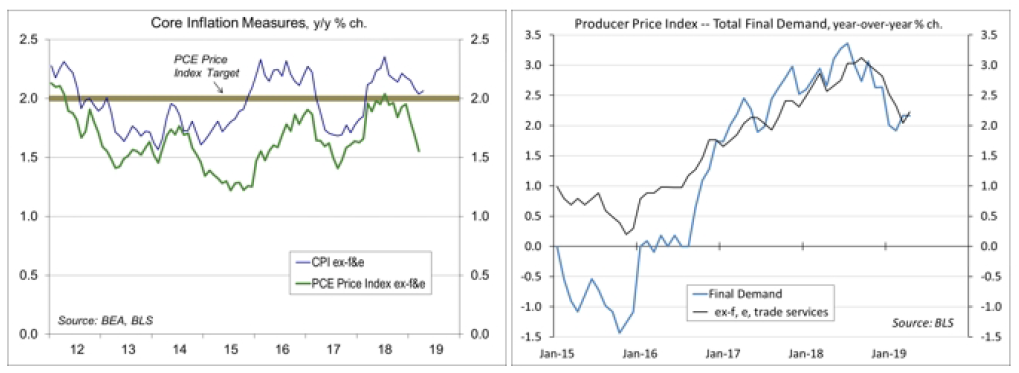
The Producer Price Index rose 0.2% in April (+2.2%). Ex-food, energy, ad trade services, the PPI rose 0.4% (+2.2% y/y). Details continued to reflect a moderation in pipeline inflation pressures (after running up in the first half of 2018). Import Prices rose 0.2% in April (-0.2% y/y), as a 6.1% rise in petroleum prices offset declines in other areas. Ex-food & fuels, import prices fell 0.3%, following a 0.2% decline in March (-1.1% y/y). Bear in mind that these figures do not include tariffs. Softer global growth appears to be putting downward pressure on prices of raw materials, intermediate goods, and finished goods.
The U.S. Trade Deficit widened slightly to $50.0 billion in March, vs. $49.3 billion in February, about what was assumed in the advance GDP report (net exports deficit added 1.0 percentage point to 1Q19 GDP growth, but that reflects a pull-forward of imports ahead of expected tariff increases).
The opinions offered by Dr. Brown should be considered a part of your overall decision-making process. For more information about this report – to discuss how this outlook may affect your personal situation and/or to learn how this insight may be incorporated into your investment strategy – please contact your financial advisor or use the convenient Office Locator to find our office(s) nearest you today.
All expressions of opinion reflect the judgment of the Research Department of Raymond James & Associates (RJA) at this date and are subject to change. Information has been obtained from sources considered reliable, but we do not guarantee that the foregoing report is accurate or complete. Other departments of RJA may have information which is not available to the Research Department about companies mentioned in this report. RJA or its affiliates may execute transactions in the securities mentioned in this report which may not be consistent with the report’s conclusions. RJA may perform investment banking or other services for, or solicit investment banking business from, any company mentioned in this report. For institutional clients of the European Economic Area (EEA): This document (and any attachments or exhibits hereto) is intended only for EEA Institutional Clients or others to whom it may lawfully be submitted. There is no assurance that any of the trends mentioned will continue in the future. Past performance is not indicative of future results.