Chief Economist Eugenio J. Alemán discusses current economic conditions.
The Federal Reserve (Fed) has been trying to slow down the U.S. economy for more than a year in order to slow down inflation. The process has, so far, been very successful, as shown by the graph below. However, economic growth has been volatile, and now it is reaccelerating once again. The latest surge in growth, to an annualized quarter over quarter rate of 4.9%, is another reminder to markets that what Fed officials have been arguing during the last year –“higher for longer”– is real. The fight to get inflation back into submission and to their long term 2.0% target is still a work in progress.
We understand what many analysts/economists are saying about inflation, and we agree with most of this. It is clear that inflation has continued its disinflationary process, and this is likely to extend in the short to medium term. However, the Fed has to be forward looking and the fact that federal funds rates of 5.25%- 5.50% are still not able to keep economic growth from accelerating will keep them from abandoning their hawkish stance.
The biggest threat the Fed is facing is that economic growth is moving up again, and this has the potential of reigniting inflationary pressures going forward. Of course, the Fed is aware that monetary policy works with “long and variable lags,” but doesn’t want to face another “failure to launch” moment and have to regret it again.
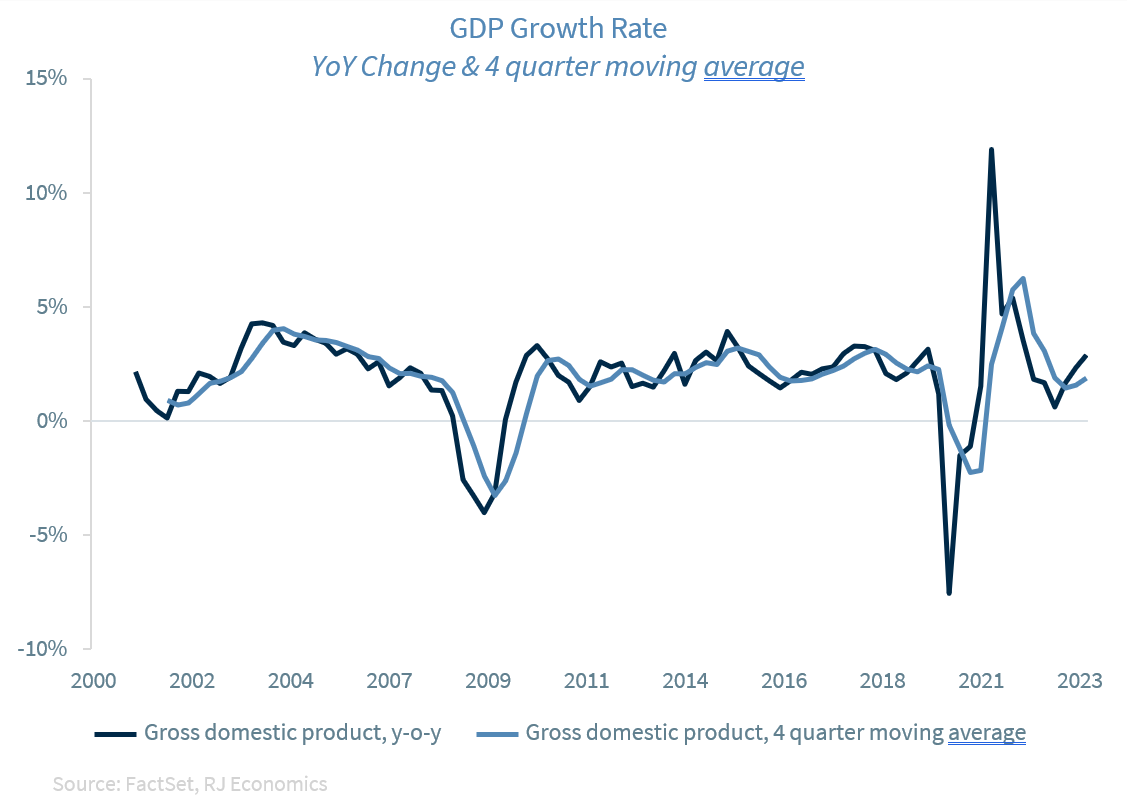
On a year over year basis, economic growth was up to 2.9% during the third quarter of the year from a year- over-year growth rate of 2.4% at the end of the second quarter. This means that economic growth is accelerating, which is not the direction Fed officials want to see for the economy. Furthermore, if we look at the four-quarter moving average rate of growth, it has also accelerated, from a rate of 1.6% during the second quarter of this year to a rate of 1.9% during the third quarter, which is the estimate of potential growth.
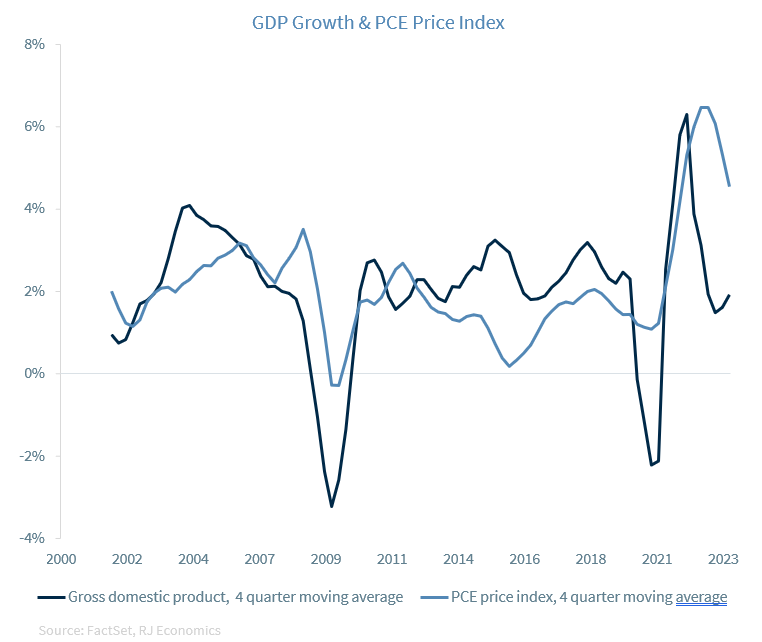
Although inflation is still coming down and we believe the disinflationary process will continue in the short to medium term, Fed officials are concerned that the re-acceleration in economic growth could be a threat for inflation in the not-so-distant future because inflation, while disinflating, is still too high, as they have argued over and over again.
The graph below should give pause to those who believe that the Fed has conquered inflation, especially if economic growth continues to accelerate (see graph below). The good news for the Fed and markets is that we still believe that economic growth is going to slow down and enter a mild recession early in 2024. If our forecast is correct, they may not have to move again. However, the Fed has left the door open to increase interest rates once more before the end of the year. If economic growth remains strong, they may need to come through with more increases in rates, even if markets are betting the Fed is already done.
Economic and market conditions are subject to change.
Opinions are those of Investment Strategy and not necessarily those of Raymond James and are subject to change without notice. The information has been obtained from sources considered to be reliable, but we do not guarantee that the foregoing material is accurate or complete. There is no assurance any of the trends mentioned will continue or forecasts will occur. Last performance may not be indicative of future results.
Consumer Price Index is a measure of inflation compiled by the US Bureau of Labor Statistics. Currencies investing is generally considered speculative because of the significant potential for investment loss. Their markets are likely to be volatile and there may be sharp price fluctuations even during periods when prices overall are rising.
Consumer Sentiment is a consumer confidence index published monthly by the University of Michigan. The index is normalized to have a value of 100 in the first quarter of 1966. Each month at least 500 telephone interviews are conducted of a contiguous United States sample.
Personal Consumption Expenditures Price Index (PCE): The PCE is a measure of the prices that people living in the United States, or those buying on their behalf, pay for goods and services. The change in the PCE price index is known for capturing inflation (or deflation) across a wide range of consumer expenses and reflecting changes in consumer behavior.
The Consumer Confidence Index (CCI) is a survey, administered by The Conference Board, that measures how optimistic or pessimistic consumers are regarding their expected financial situation. A value above 100 signals a boost in the consumers’ confidence towards the future economic situation, as a consequence of which they are less prone to save, and more inclined to consume. The opposite applies to values under 100.
Certified Financial Planner Board of Standards Inc. owns the certification marks CFP®, CERTIFIED FINANCIAL PLANNER™, CFP® (with plaque design) and CFP® (with flame design) in the U.S., which it awards to individuals who successfully complete CFP Board’s initial and ongoing certification requirements.
Links are being provided for information purposes only. Raymond James is not affiliated with and does not endorse, authorize or sponsor any of the listed websites or their respective sponsors. Raymond James is not responsible for the content of any website or the collection or use of information regarding any website’s users and/or members.
GDP Price Index: A measure of inflation in the prices of goods and services produced in the United States. The gross domestic product price index includes the prices of U.S. goods and services exported to other countries. The prices that Americans pay for imports aren’t part of this index.
The Conference Board Leading Economic Index: Intended to forecast future economic activity, it is calculated from the values of ten key variables.
The Conference Board Coincident Economic Index: An index published by the Conference Board that provides a broad-based measurement of current economic conditions.
The Conference Board lagging Economic Index: an index published monthly by the Conference Board, used to confirm and assess the direction of the economy’s movements over recent months.
The U.S. Dollar Index is an index of the value of the United States dollar relative to a basket of foreign currencies, often referred to as a basket of U.S. trade partners’ currencies. The Index goes up when the U.S. dollar gains “strength” when compared to other currencies.
The FHFA House Price Index (FHFA HPI®) is a comprehensive collection of public, freely available house price indexes that measure changes in single-family home values based on data from all 50 states and over 400 American cities that extend back to the mid-1970s.
Import Price Index: The import price index measure price changes in goods or services purchased from abroad by U.S. residents (imports) and sold to foreign buyers (exports). The indexes are updated once a month by the Bureau of Labor Statistics (BLS) International Price Program (IPP).
ISM New Orders Index: ISM New Order Index shows the number of new orders from customers of manufacturing firms reported by survey respondents compared to the previous month. ISM Employment Index: The ISM Manufacturing Employment Index is a component of the Manufacturing Purchasing Managers Index and reflects employment changes from industrial companies.
ISM Inventories Index: The ISM manufacturing index is a composite index that gives equal weighting to new orders, production, employment, supplier deliveries, and inventories.
ISM Production Index: The ISM manufacturing index or PMI measures the change in production levels across the U.S. economy from month to month.
ISM Services PMI Index: The Institute of Supply Management (ISM) Non-Manufacturing Purchasing Managers’ Index (PMI) (also known as the ISM Services PMI) report on Business, a composite index is calculated as an indicator of the overall economic condition for the non-manufacturing sector.
Consumer Price Index (CPI) A consumer price index is a price index, the price of a weighted average market basket of consumer goods and services purchased by households. Changes in measured CPI track changes in prices over time.
Producer Price Index: A producer price index (PPI) is a price index that measures the average changes in prices received by domestic producers for their output.
Industrial production: Industrial production is a measure of output of the industrial sector of the economy. The industrial sector includes manufacturing, mining, and utilities. Although these sectors contribute only a small portion of gross domestic product, they are highly sensitive to interest rates and consumer demand.
The NAHB/Wells Fargo Housing Opportunity Index (HOI) for a given area is defined as the share of homes sold in that area that would have been affordable to a family earning the local median income, based on standard mortgage underwriting criteria.
The S&P CoreLogic Case-Shiller U.S. National Home Price NSA Index measures the change in the value of the U.S. residential housing market by tracking the purchase prices of single-family homes.
The S&P CoreLogic Case-Shiller 20-City Composite Home Price NSA Index seeks to measures the value of residential real estate in 20 major U.S. metropolitan.
Source: FactSet, data as of 7/7/2023
Markets & Investing Members of the Raymond James Investment Strategy Committee share their views on...
Markets & Investing Review the latest Weekly Headings by CIO Larry Adam. Key Takeaways ...
Technology & Innovation Learn about a few simple things you can do to protect your personal information...