Chief Economist Scott Brown discusses current economic conditions.
On Monday, the Treasury Department is expected to report a March budget deficit of about $658 billion, bringing the 12-month total to nearly $4.1 trillion, about 19% of GDP. Proponents argue that the added spending, with more to come, will help to ensure the recovery. Critics charge that it’s overkill, likely to push aggregate demand ahead of supply. The debate over infrastructure spending will amplify these divisions.
The increase in spending reflects last year’s $2.2 trillion Coronavirus Aid, Relief, and Economic Security Act (CARES Act), the $900 billion Health and Economic Recovery Omnibus Emergency Solutions Act (Heroes Act), and the $1.9 trillion American Rescue Plan Act of 2021. While the three bills total $4.0 trillion, not all of that has been spent. Remember, the annual deficit was on track to exceed $1 trillion before the pandemic. Unlike the Tax Cut and Jobs Act of 2017 (TCJA), which focused relief at the upper end of the income scale, the American Rescue Plan provides larger tax cuts (percentage-wise) to lower income households. The Tax Policy Center estimates that households making under $25,000, would see an after- tax income gain of 20%, and about 35% if they have children. A middle-income household would see a gain of 5.5%.
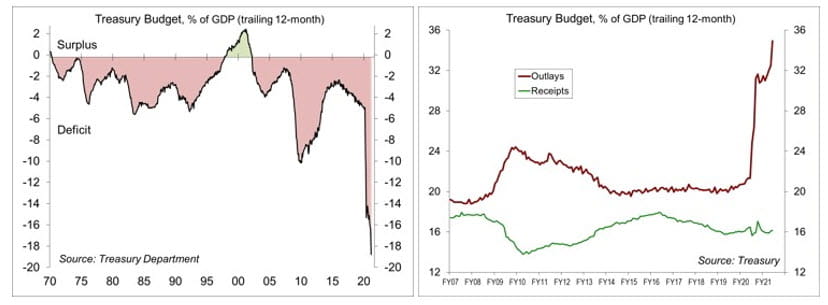
Government spending fell after the fiscal response to the financial crisis and we can expect it to fall again in this recovery. However, support following the financial crisis, while helping to limit the damage, was not enough to propel the recovery forward. This time, spending will continue into 2022.
Some of the spending will be hard to get rid of. For example, if childhood poverty is cut in half, as many expect, why would you want to do that for just one year? Much of the added spending, including child tax credits, is popular.
The Biden administration has now proposed a $2 trillion infrastructure plan, which broadens the definition of “infrastructure” well beyond roads and bridges, and in its FY22 budget proposal, has asked Congress for a 16% increase in federal spending on domestic priorities, including education, fighting climate change, and reducing poverty.
So how will we pay for all of this? Partly through an increase in corporate taxes, increased enforcement (going after tax cheaters), and reducing “tax expenditures” (tax breaks embedded in the tax code). All of that could be done through tax reform, but that’s viewed as politically unfeasible.
Of course, not all of the added spending has to be paid for. The government is nothing like a household or business. It doesn’t have to balance its budget or pay down its debt. It just has to meet interest payments and roll over maturing debt – there is no problem in doing so now. Investment in infrastructure, education, childcare, and research and development should pay off over the long run, leading to a more productive, efficient, and larger economy, but we won’t know for sure until it happens.
Recent Economic Data
The minutes of the March 16-17 Federal Open Market Committee showed that most Fed officials expected a transitory increase in inflation. Inflation risks were seen as balanced. Several officials feared that supply disruptions and strong demand would push inflation higher than expected, while several others felt that the factors that had kept inflation down could exert more downward pressure on inflation.
The ISM Services Index rose to 63.7 in March, from 55.3 in February, partly reflecting a rebound from bad weather. The report showed business activity, new orders, and employment rising at a faster pace, while supplier delivery times lengthened further and input price pressures continued to rise.
In its revised World Economic Outlook, the IMF raised expectations for global growth (+6.0% y/y), led by stronger expectations for the U.S. (fueled by the faster arrival of vaccines and further fiscal stimulus).
The Producer Price Index rose 1.0% in March (+4.2% y/y), reflecting an 8.8% increase in gasoline (+52.5% y/y). Ex-food, energy, and trade services, the PPI rose 0.6% (+3.1% y/y).

Factory Orders fell 0.8% in February, reflecting bad weather.
The trade deficit widened to $71.1 billion in February, vs. $67.8 billion in January and $38.0 billion a year earlier. Merchandise exports fell 3.5% (-5.1% y/y), reflecting bad weather. Merchandise imports fell 0.9% (+10.3% y/y).
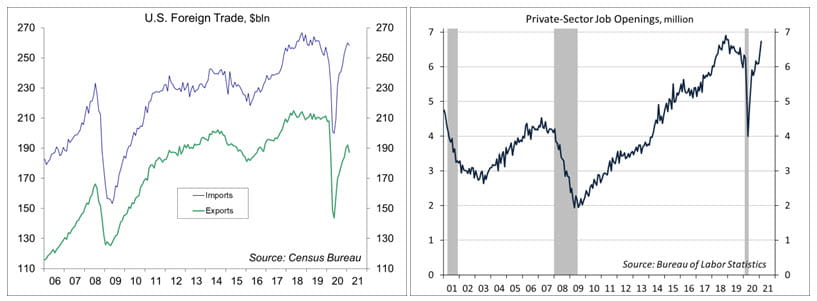
JOLTS data for February showed that job openings rose to 7.37 million in February (6.73 million private sector).
Gauging the Recovery
The New York Fed’s Weekly Economic Index rose to +9.52% for the week ending April 3, up from +8.13% a week earlier (revised from +7.25%), signifying strength relative to the weak data of a year ago. The WEI is scaled to year-over-year GDP growth.
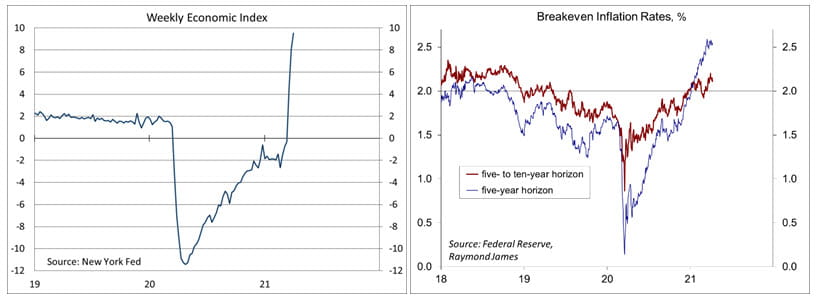
Breakeven inflation rates (the difference between inflation-adjusted and fixed-rate Treasuries) continue to suggest a moderately higher inflation outlook for the next five years, but the outlook five to ten years out remains close to the Fed’s long-term goal of 2% (consistent with the Fed’s revised monetary policy framework).
The trend in COVID-19 cases appears to be stabilizing, down sharply from the start of the year, but still relatively high (about the peak of the second wave). More than 540,000 have died from COVID-19 in the U.S.

Jobless claims rose by 16,000, to 744,000, in the week ending April 3. The overall trend is gradually lower, but the level remains quite high by pre-pandemic standards. The continued elevated level of claims appears to partly reflect people repeatedly getting short-term work.
The University of Michigan’s Consumer Sentiment Index rose to 84.9 (a 12-month high) in the full-month assessment for March (the survey covered February 24 to March 22), vs. 83.0 at mid-month and 76.8 in February. The report noted gains from disbursement of relief checks and better than anticipated vaccination progress. The data point toward “robust increases in consumer spending.”
The opinions offered by Dr. Brown are provided as of the date above and subject to change. For more information about this report – to discuss how this outlook may affect your personal situation and/or to learn how this insight may be incorporated into your investment strategy – please contact your financial advisor or use the convenient Office Locator to find our office(s) nearest you today.
This material is being provided for informational purposes only. Any information should not be deemed a recommendation to buy, hold or sell any security. Certain information has been obtained from third-party sources we consider reliable, but we do not guarantee that such information is accurate or complete. This report is not a complete description of the securities, markets, or developments referred to in this material and does not include all available data necessary for making an investment decision. Prior to making an investment decision, please consult with your financial advisor about your individual situation. Investing involves risk and you may incur a profit or loss regardless of strategy selected. There is no guarantee that the statements, opinions or forecasts provided herein will prove to be correct.
Markets & Investing Members of the Raymond James Investment Strategy Committee share their views on...
Markets & Investing Review the latest Weekly Headings by CIO Larry Adam. Key Takeaways ...
Technology & Innovation Learn about a few simple things you can do to protect your personal information...