March 15, 2021
Drew O’Neil discusses fixed income market conditions and offers insight for bond investors.
For most fixed income investors, 2020 was a whirlwind of emotions that, unfortunately, left many investors in the same place at the end of the year: sitting on the sidelines and waiting for what they felt was a good opportunity to put money back to work. What many were waiting for was higher yields and a steeper curve. Two and a half months into 2021, many investors have gotten what they wished for. Treasury yields have been moving consistently higher since January 1st, with the benchmark 10-year yield increasing from 0.93% at the beginning of the year to 1.64% as of Friday’s close, and the 30-year moving from 1.66% to 2.40% over the same timeframe. With these moves on the intermediate and long parts of the curve and the Fed holding short-term rates down, most of the Treasury curve is offering both higher yields and a steeper slope.
While Treasury yields make a good headline, what may interest many investors are the corporate bond and municipal bond curves, as these are the products that they are using for their fixed income allocation. So what has happened in these markets so far in 2021? Luckily for most investors, both of these markets have followed in the footsteps of the Treasury market with higher yields and steeper curves.
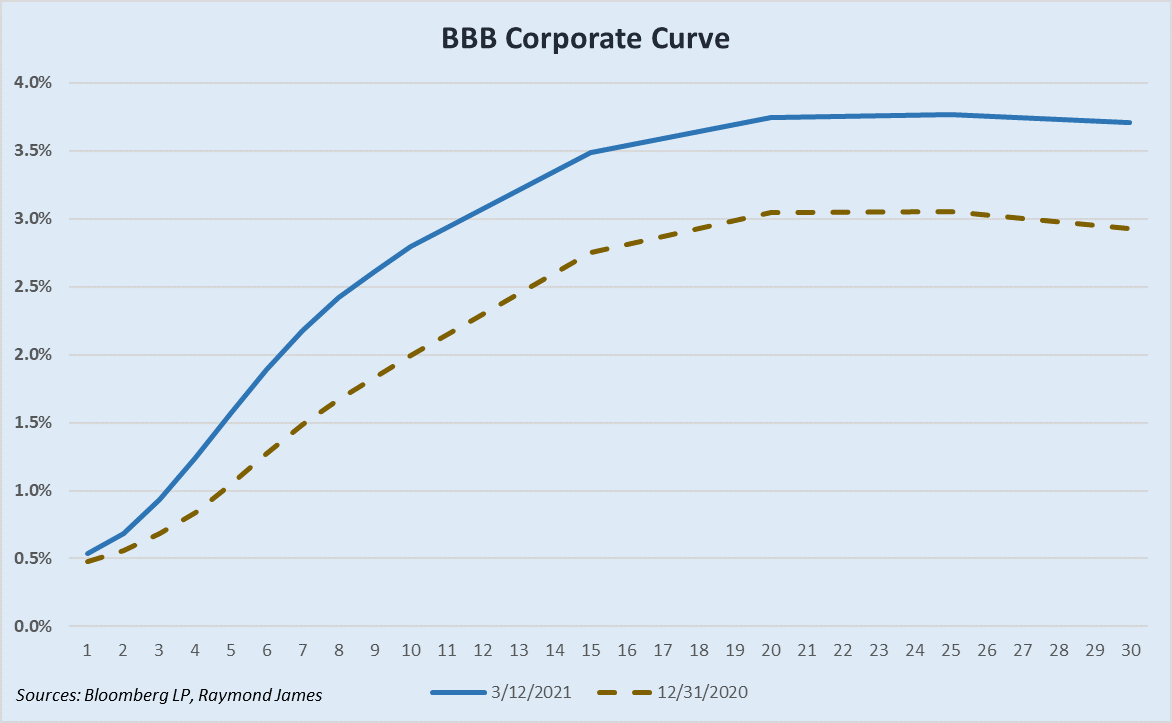
Looking at both graphs, the moves to higher yielding, steeper curves are obvious. The 5-year BBB corporate yield has increased by 53 basis points so far this year, while the 10-year yield has increased by 80 basis points. The slope of the curve, as measured by the 1 to 10 year spread, has increased from 152 to 226 basis points, which is a fairly significant move in such a short time. A steeper curve means that investors receive more reward (yield) for extending out into longer maturity bonds (e.g. taking on more risk). Essentially, the steeper the curve, the more the risk/reward pendulum swings in the favor of the investor as they consider investing in longer maturities. This is why a good strategy for most investors is to position in the steepest part of the curve, which is currently the ~4 to 10 year range for corporate bonds.
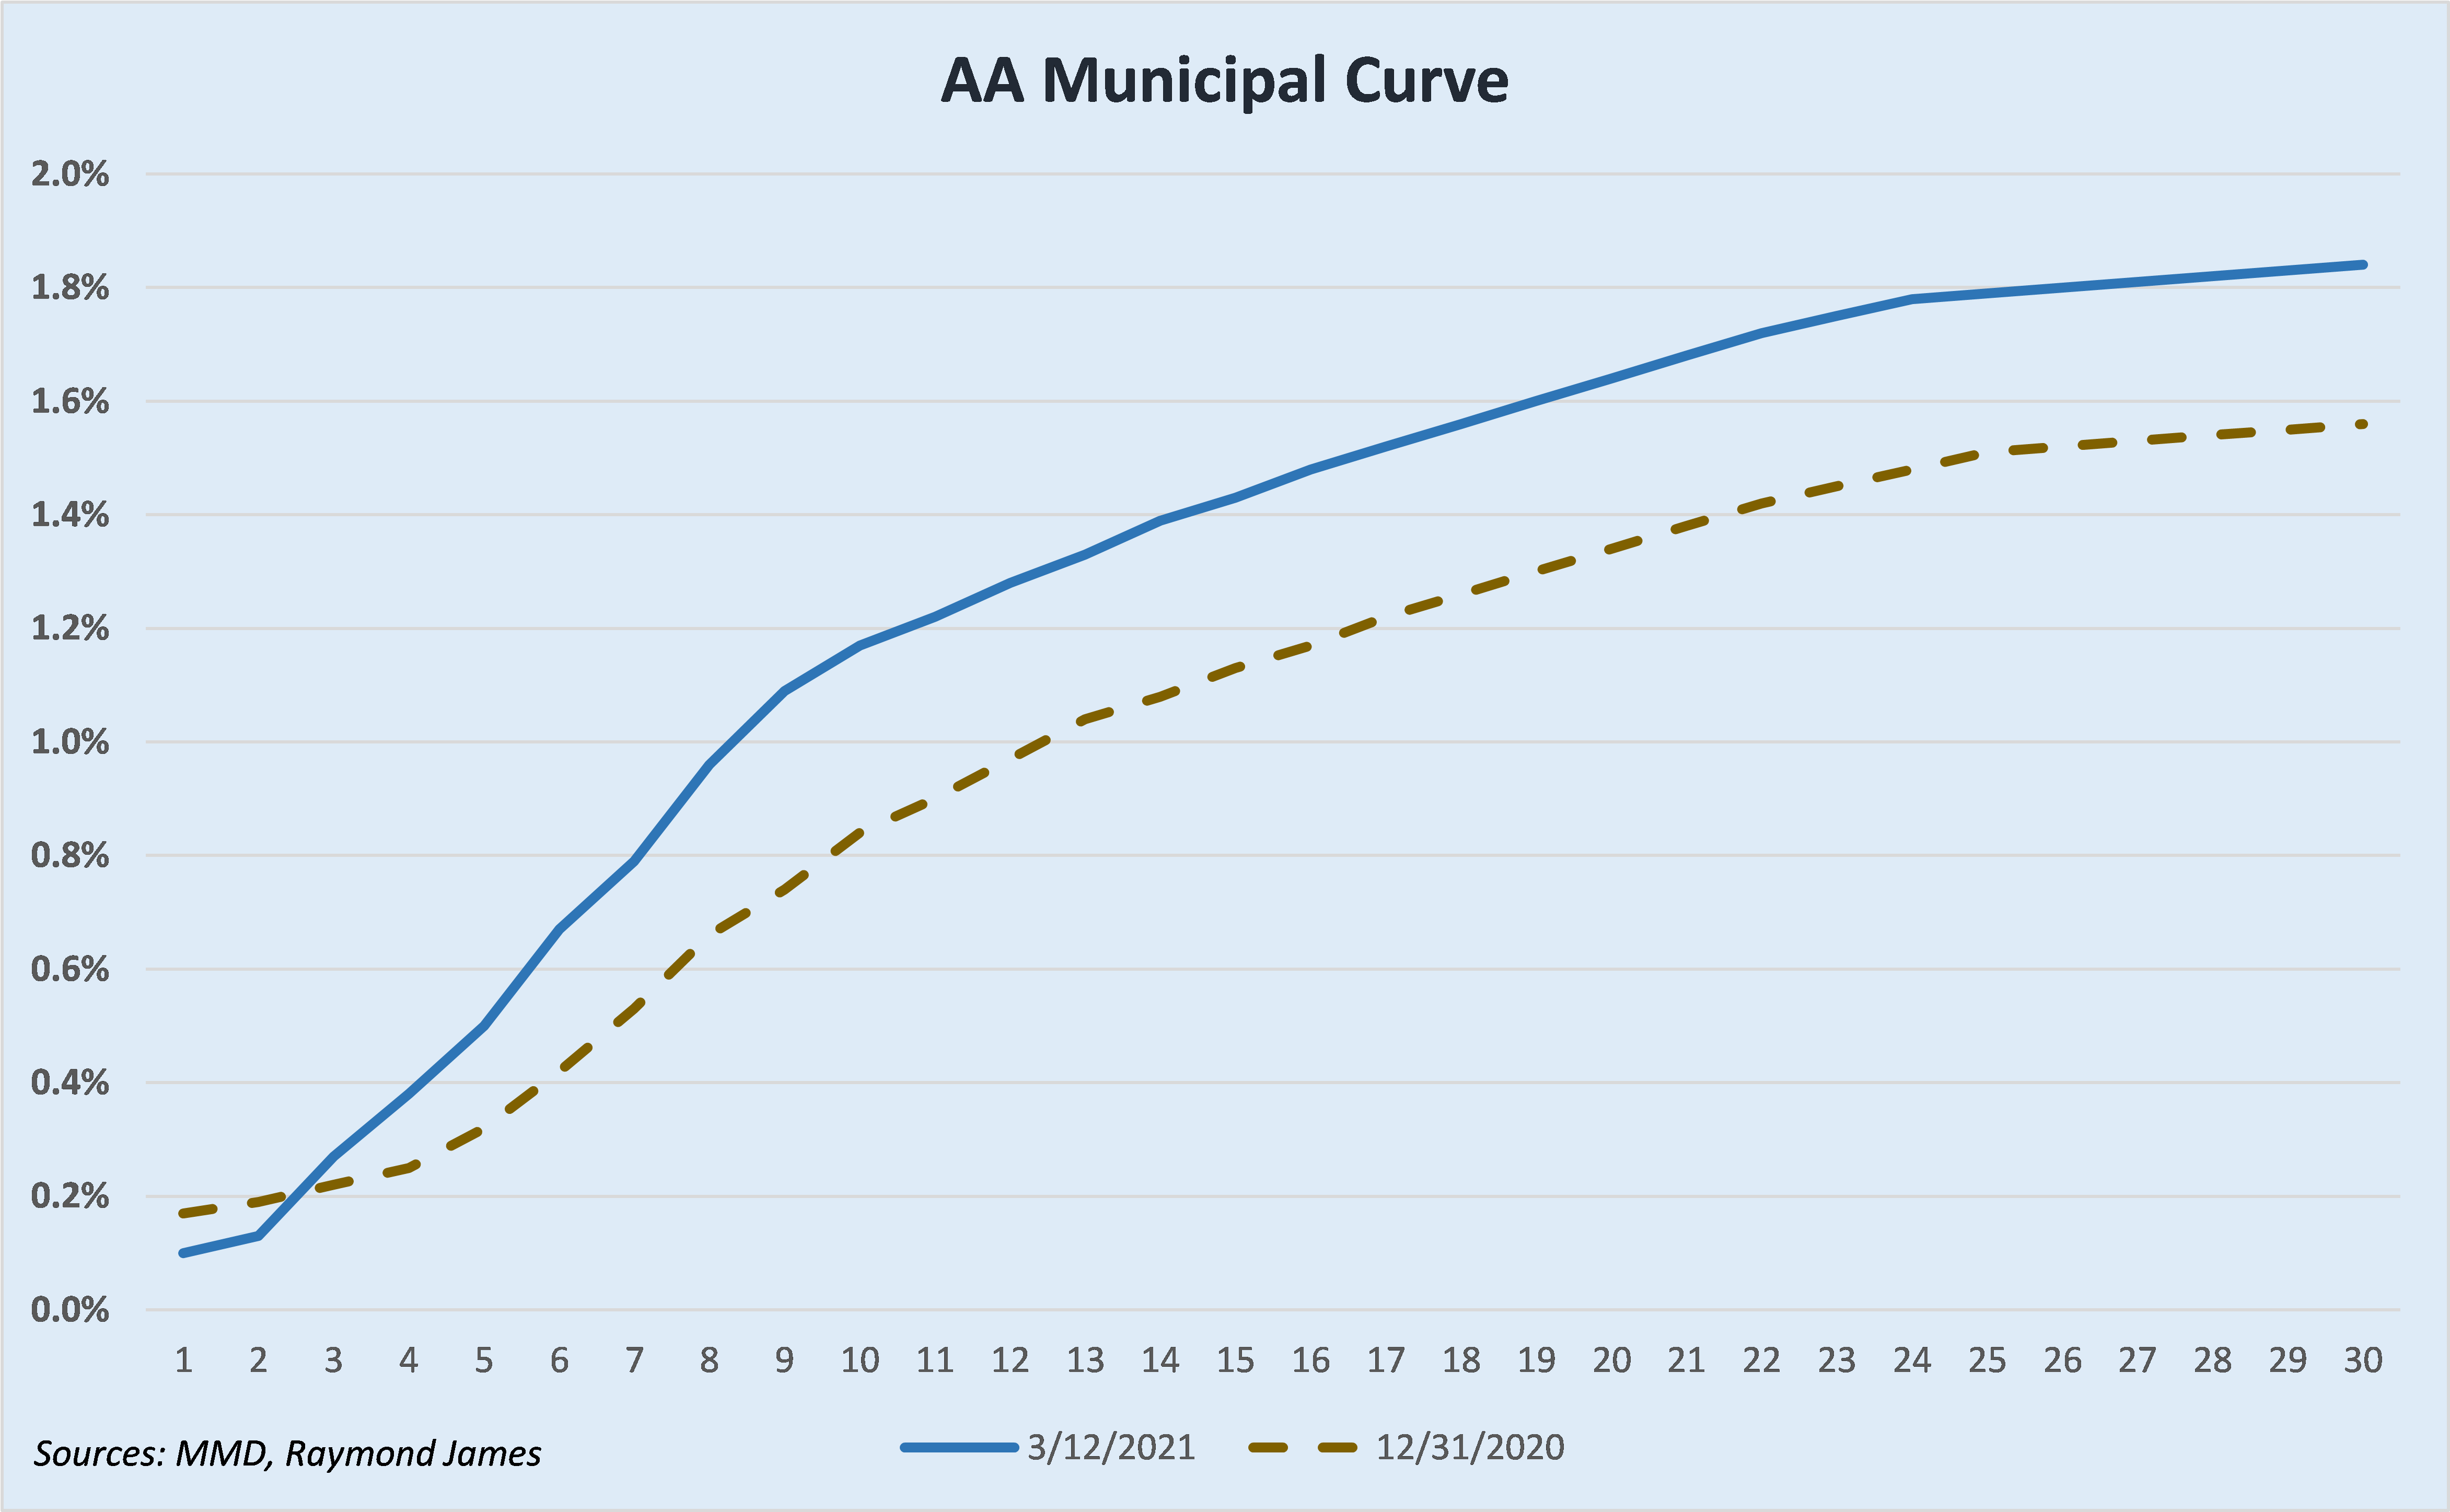
The municipal graph (below) shows a similar story. Yields in the intermediate and longer parts of the curve have moved higher, while the short end of the curve has remained anchored, giving us both higher yields and a steeper curve. The 5 to 15 year range on the curve currently provides the most value in the municipal space. For investors in the 37% tax bracket, taxable equivalent yields for AA-rated municipals in this range have increased ~48-56 basis points since the start of the year.
There is a lot of money “on the sidelines” and from our many conversations with investors, it seems that many people have been waiting for exactly what has happened over the first two and a half months of the year. Everyone’s situation is different, but for investors who have been waiting on an opportunity, take a look at the ground that the market has covered so far in 2021. Now might be an opportune time to start allocating your fixed income dollars that have been waiting on the sidelines.
To learn more about the risks and rewards of investing in fixed income, please access the Securities Industry and Financial Markets Association’s “Learn More” section of investinginbonds.com, FINRA’s “Smart Bond Investing” section of finra.org, and the Municipal Securities Rulemaking Board’s (MSRB) Electronic Municipal Market Access System (EMMA) “Education Center” section of emma.msrb.org.
The author of this material is a Trader in the Fixed Income Department of Raymond James & Associates (RJA), and is not an Analyst. Any opinions expressed may differ from opinions expressed by other departments of RJA, including our Equity Research Department, and are subject to change without notice. The data and information contained herein was obtained from sources considered to be reliable, but RJA does not guarantee its accuracy and/or completeness. Neither the information nor any opinions expressed constitute a solicitation for the purchase or sale of any security referred to herein. This material may include analysis of sectors, securities and/or derivatives that RJA may have positions, long or short, held proprietarily. RJA or its affiliates may execute transactions which may not be consistent with the report’s conclusions. RJA may also have performed investment banking services for the issuers of such securities. Investors should discuss the risks inherent in bonds with their Raymond James Financial Advisor. Risks include, but are not limited to, changes in interest rates, liquidity, credit quality, volatility, and duration. Past performance is no assurance of future results.
Stocks are appropriate for investors who have a more aggressive investment objective, since they fluctuate in value and involve risks including the possible loss of capital. Dividends will fluctuate and are not guaranteed. Prior to making an investment decision, please consult with your financial advisor about your individual situation.
Markets & Investing Members of the Raymond James Investment Strategy Committee share their views on...
Markets & Investing Review the latest Weekly Headings by CIO Larry Adam. Key Takeaways ...
Technology & Innovation Learn about a few simple things you can do to protect your personal information...