Rob Tayloe discusses fixed income market conditions and offers insight for bond investors.
There has been an extraordinary move in domestic bond rates of all types in the first five and a half months of 2022. The primary driver behind the market move has been the Federal Reserve’s (Fed) inability to keep prices in check. The Consumer Price Index (CPI) YoY has been in excess of the Fed’s target for inflation of 2% for the past 15 months in a row. This CPI reading has been in excess of 8% for the past three months reaching a high of 8.6% for the May ’22 reading (largest CPI YoY print since December 1981). There has been much conjecture about how to position fixed income portfolios in this environment and whether the Fed’s reaction to inflation will ultimately drive our economy into a recession.
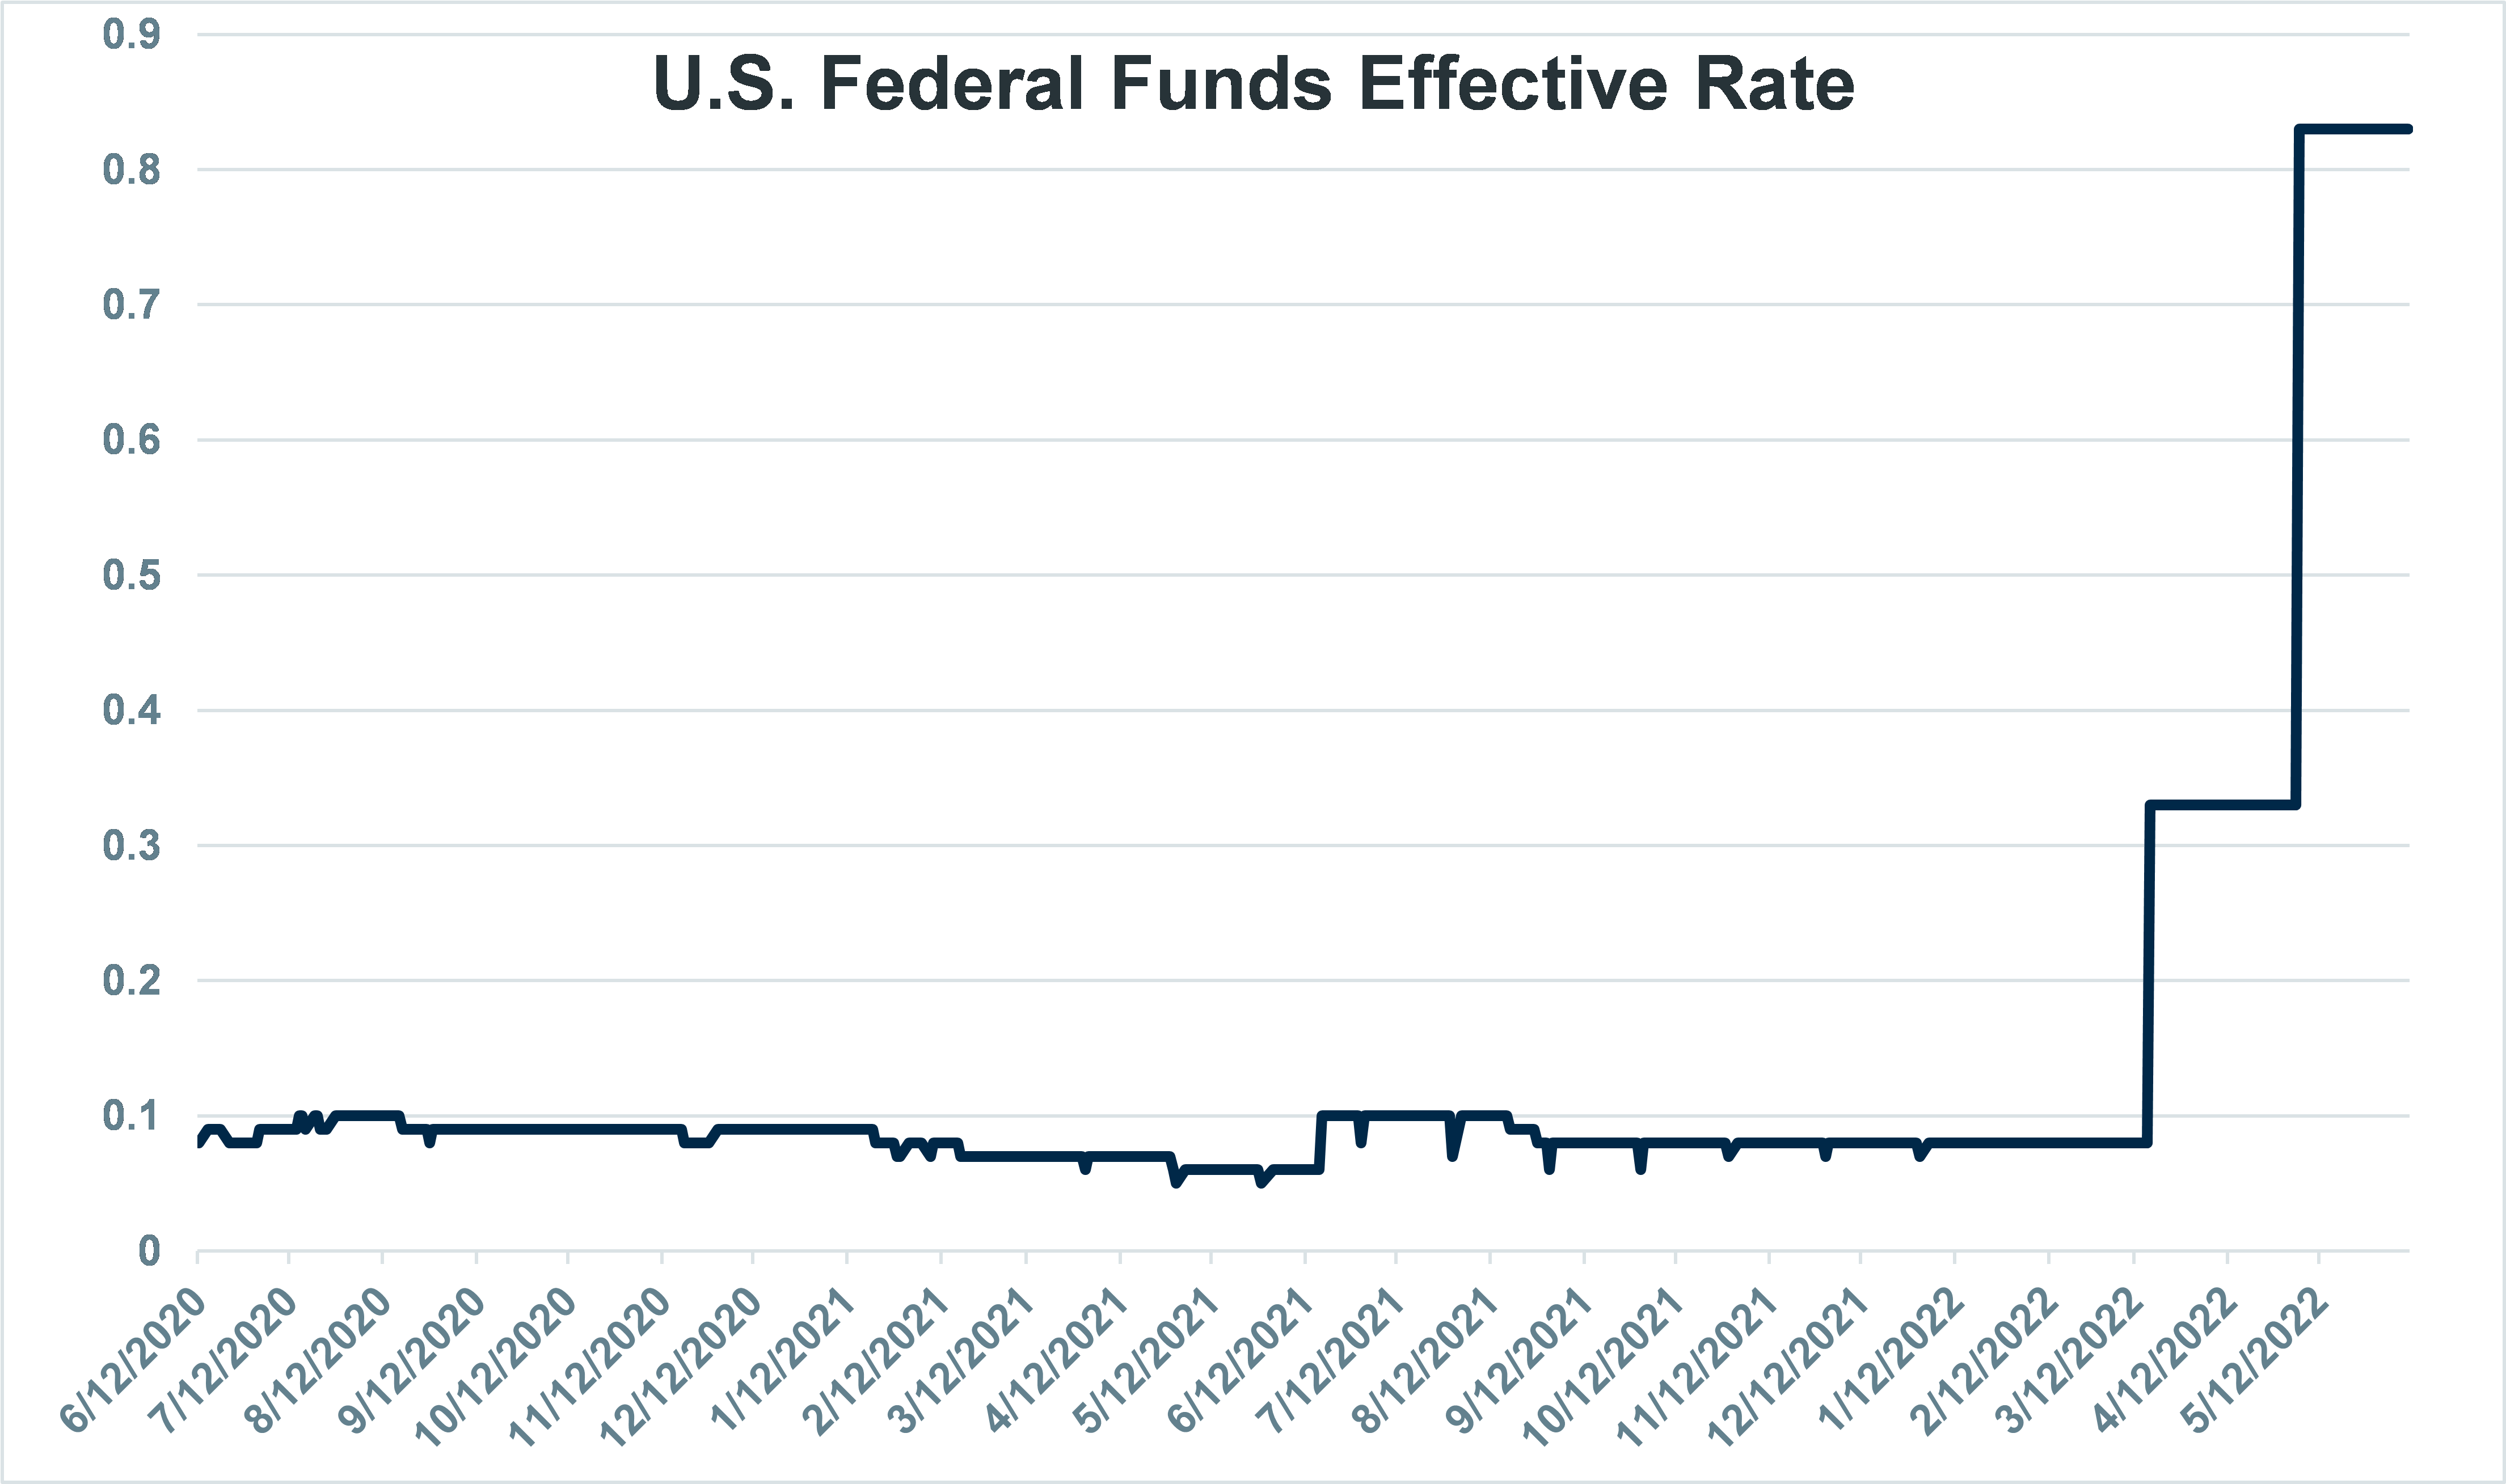
To combat elevated inflation, the Fed is becoming more aggressive in raising short term interest rates. The Federal Funds Effective rate (Fed Funds) is the percent at which banks lend and borrow from each other overnight. The Effective Fed Funds rate hovered between 5 and 10 basis points between April ’20 and March ’22. The effective rate for Fed Funds is at 83 basis points currently and is expected with anticipation of another 50-75 basis points increase at the June 15 meeting. As of this writing, the Fed is expected to increase this rate as much as 250 basis points between now and the end of the year.
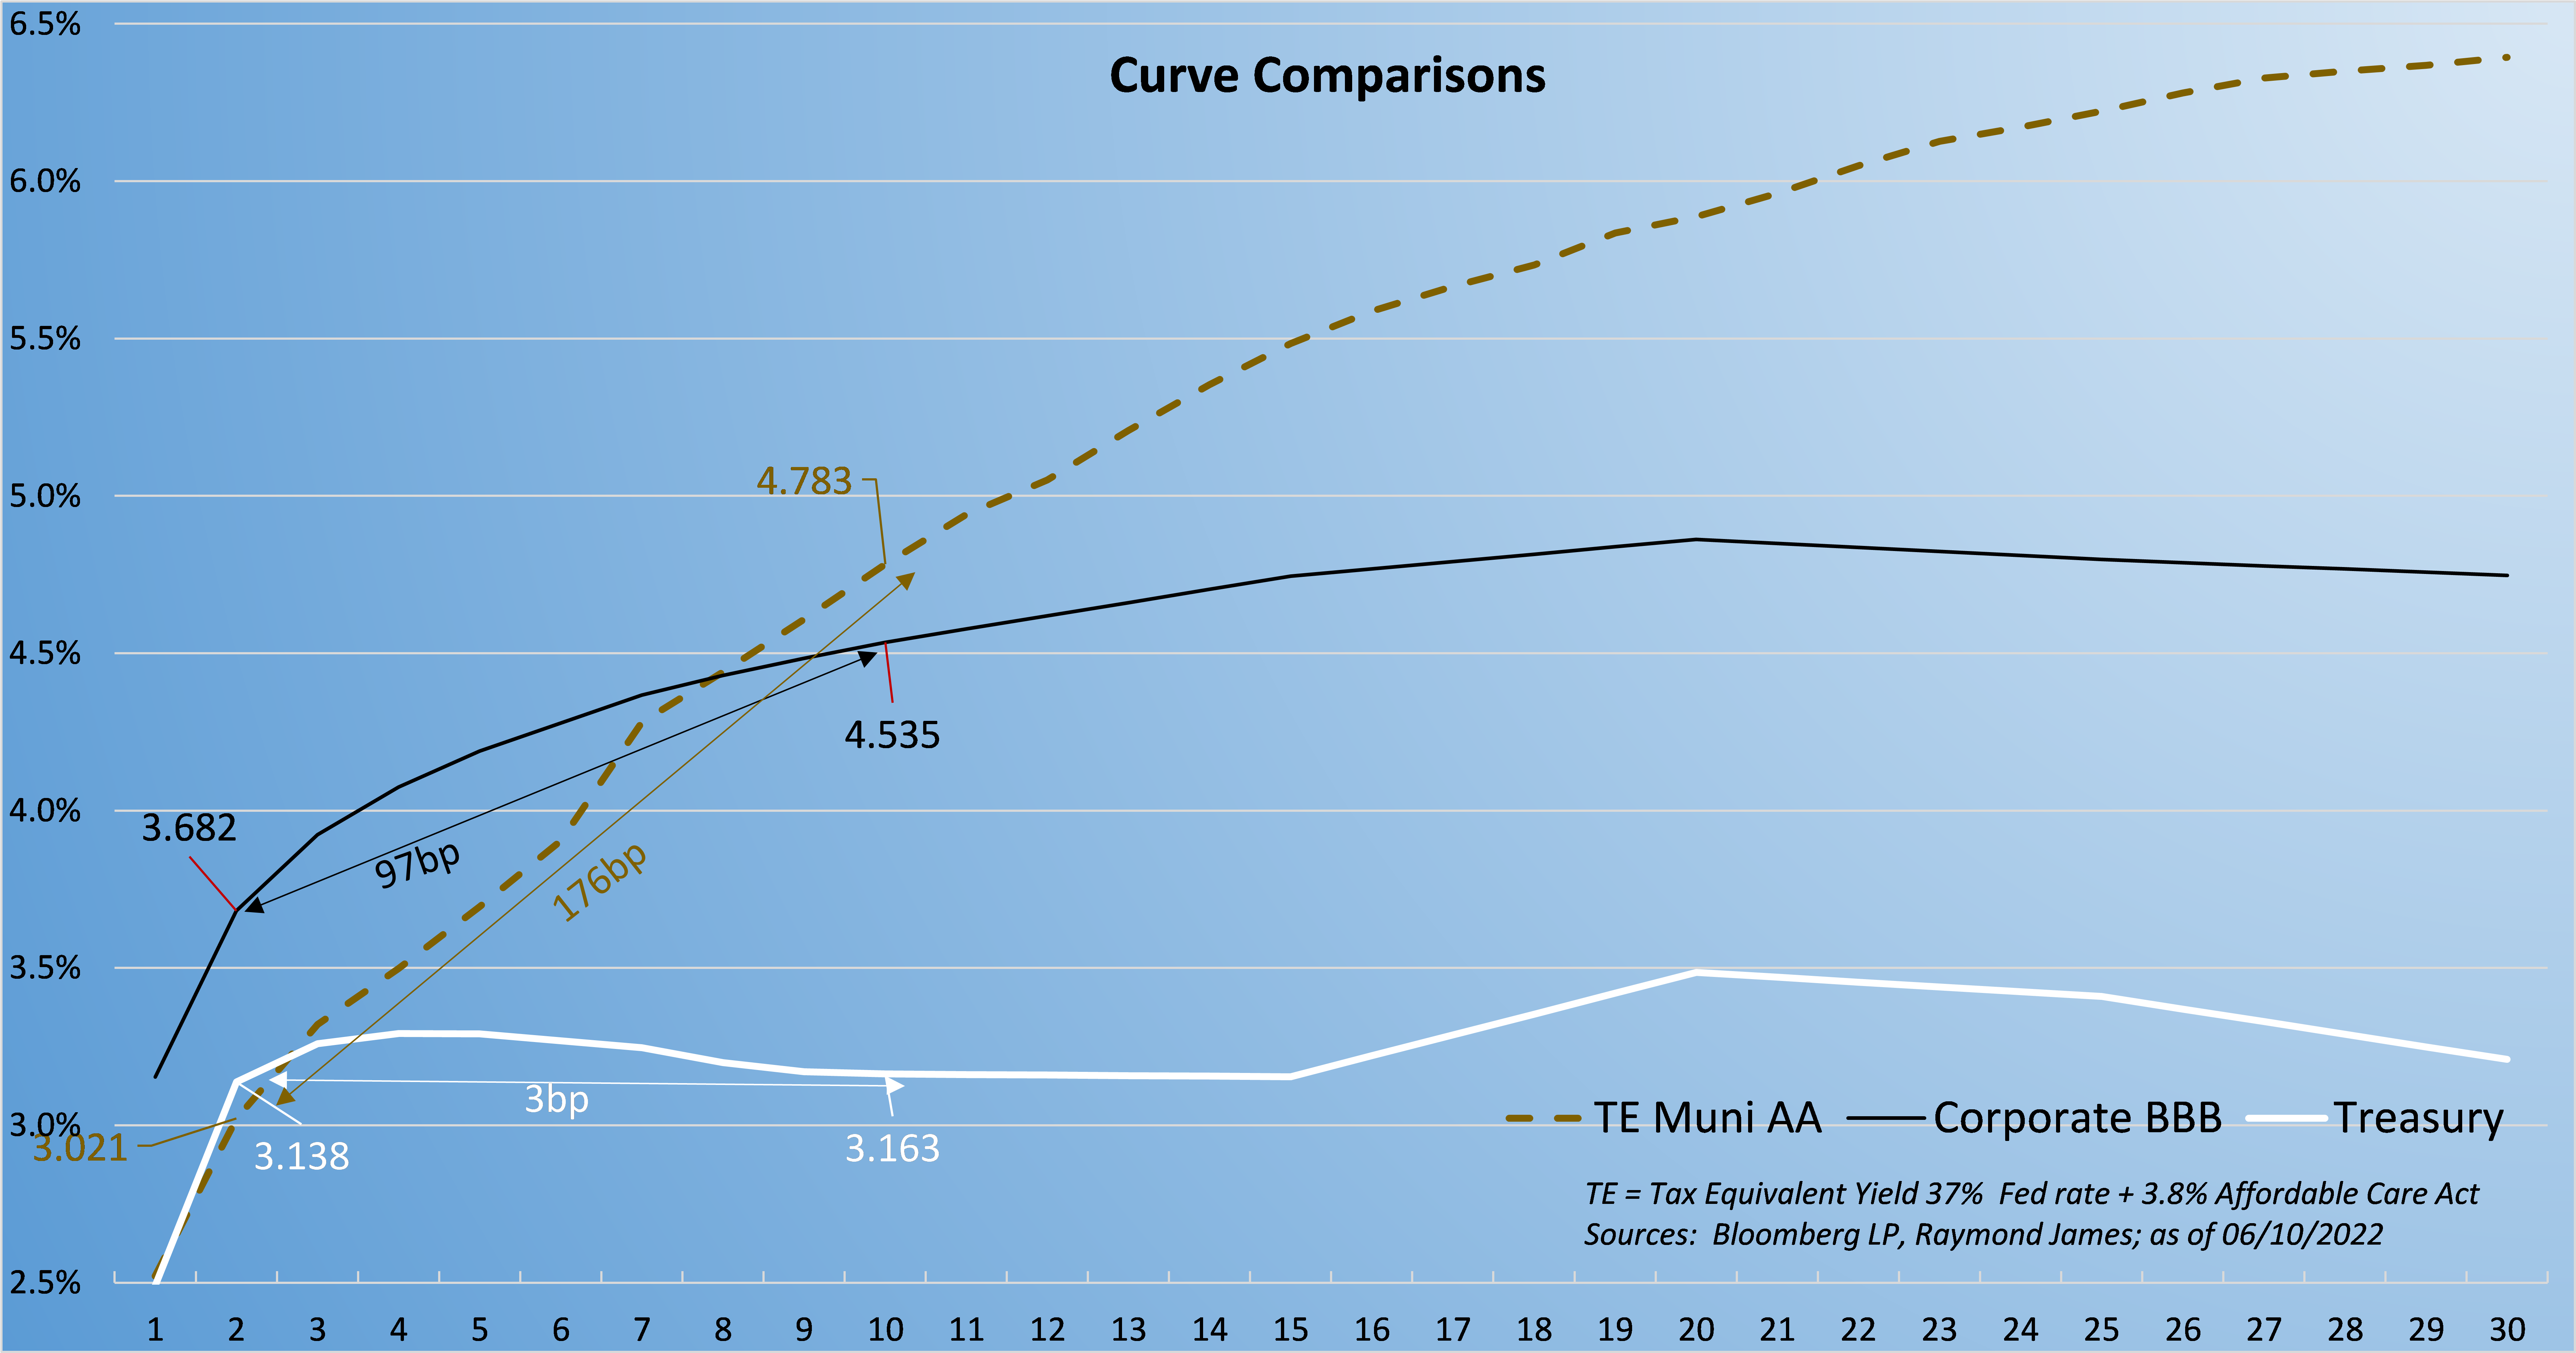
These moves have also created higher rates on longer dated fixed income securities. If you look at what Treasuries have done year to date, the 2 year has gone from a 0.73% yield to around a yield of 3.20%. The 10 year opened the year at a 1.51% yield and is around 3.24% now. Yields have also increased in corporate and municipal bonds. 2 year A rated corporate bonds were yielding around 90 basis points at the beginning of this year and are around 3.44% now. 10 year A rated corporate bonds were around a 2.25% yield at the beginning of the year and are now hovering around 4.40%. The same applies to municipal bonds. 2 year AAA muni’s were yielding 22 basis points to begin the year and are now around 1.75%. 10 year muni’s were yielding a little north of 1% to begin the year and are now around 2.60%. On the graph on the following page, note that the Treasury curve is relatively flat, both the corporate and municipal curves maintain positive slopes and provide investors attractive value when extending out past the short maturities.
With the move in rates seen this year, where on the curve should bond portfolios be positioned? It is important to not only diversify portfolios by name, but also to diversify maturities and call dates in a portfolio, with the desire to reduce reinvestment risk. For example, if all of the maturities in a portfolio occurred in the time period between COVID and the end of 2021, investors would have had to revinvest those proceeds in a low yield environment. There is not a one size fits all strategy in fixed income. Some investors are comfortable staying inside 5 years while others are willing to take on more duration. It is important for investors to ladder bonds within their comfort zones.
We may look up 12 months from now and see that CPI has retraced back to or even lower than the Fed’s 2% target level. We may have seen the Fed move too quickly in their efforts to curb inflation and push the economy in a recession. However, it is important to find that comfort zone for each investor, and ladder maturities and names within that time frame.
The author of this material is a Trader in the Fixed Income Department of Raymond James & Associates (RJA), and is not an Analyst. Any opinions expressed may differ from opinions expressed by other departments of RJA, including our Equity Research Department, and are subject to change without notice. The data and information contained herein was obtained from sources considered to be reliable, but RJA does not guarantee its accuracy and/or completeness. Neither the information nor any opinions expressed constitute a solicitation for the purchase or sale of any security referred to herein. This material may include analysis of sectors, securities and/or derivatives that RJA may have positions, long or short, held proprietarily. RJA or its affiliates may execute transactions which may not be consistent with the report’s conclusions. RJA may also have performed investment banking services for the issuers of such securities. Investors should discuss the risks inherent in bonds with their Raymond James Financial Advisor. Risks include, but are not limited to, changes in interest rates, liquidity, credit quality, volatility, and duration. Past performance is no assurance of future results.
Investment products are: not deposits, not FDIC/NCUA insured, not insured by any government agency, not bank guaranteed, subject to risk and may lose value.
To learn more about the risks and rewards of investing in fixed income, access the Securities Industry and Financial Markets Association’s Project Invested website and Investor Guides at www.projectinvested.com/category/investor-guides, FINRA’s Investor section of finra.org, and the Municipal Securities Rulemaking Board’s (MSRB) Electronic Municipal Market Access System (EMMA) at emma.msrb.org.
Markets & Investing Members of the Raymond James Investment Strategy Committee share their views on...
Markets & Investing Review the latest Weekly Headings by CIO Larry Adam. Key Takeaways ...
Technology & Innovation Learn about a few simple things you can do to protect your personal information...