Chief Economist Eugenio J. Alemán discusses current economic conditions.
The economic numbers that have been released so far this year seem to be pointing to a strong performance for the U.S. economy. We still don’t know if these results are a consequence of warmer temperatures during the month compared to December of last year but what is clear is that warmer temperatures may have contributed to a better than expected employment, retail and food services sales as well as ISM Services PMI number in January. That is, consumer demand fell off a cliff at the end of last year and has recovered soundly in January, with retail and food services surging by 3.0%, with the highest increases recorded in department stores sales, up 17.5% during the month, while sales at food services and drinking places surged 7.2%.
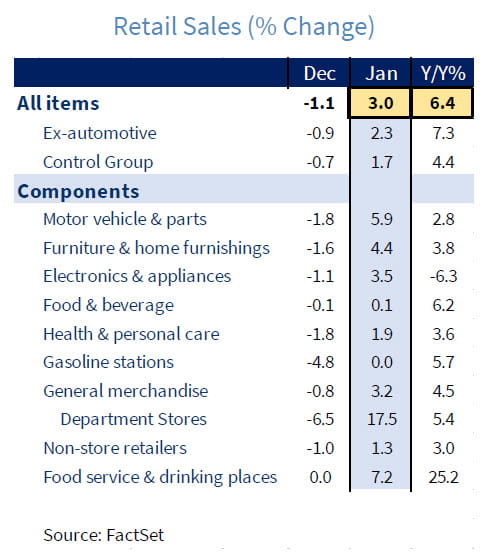
For those that have been doubting the number of new jobs created during the month of January, more than half a million workers, the increase in retail sales during the month should put thosedoubts to rest. But it wasn’t only jobs and retail sales that were strong in January. The ISM Services PMI was also very strong after a weak performance in December and initial jobless claims as well as JOLTS also showed that employment remained very tight.
Furthermore, even though the Bureau of Labor Statistics revised some of the characteristics of the consumer price index (both the weights as well as the seasonal adjustments were updated), it nevertheless showed that prices remained stronger than what the Federal Reserve (Fed) would have liked. At the same time, the Producer Price Index was also higher than expected in January so this will probably add to the anxiety regarding inflation as well as monetary policy going forward.
Why do we think markets are not correct and the Fed is?
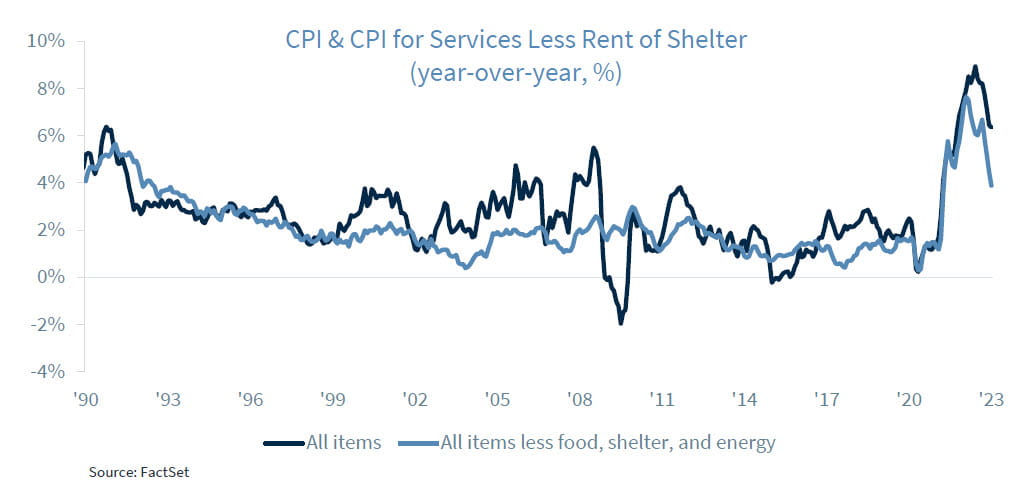
Since we are on the topic of inflation, for several weeks we have tried to understand the Fed Chairman’s concerns with “services less rent of shelter.” During the Chairman’s latest press conference, he said that “we have not seen any slowdown in core service prices excluding shelter.” We already wrote about how the Fed understands its job of bringing the rate of inflation to a 2% average over time. You can find this discussion in our Weekly Economics published on January 13, 2023 but wanted to add the following to that discussion.
The reason the Fed Chairman hasn’t seen much relief from “core service prices excluding shelter” has to do with how inflation is measured. If we measure inflation on a year-earlier basis, then what the Chairman said made no sense as shown in the following graph. The component of CPI “services less rent of shelter” has been coming down for several months. The same thing is happening to overall CPI.
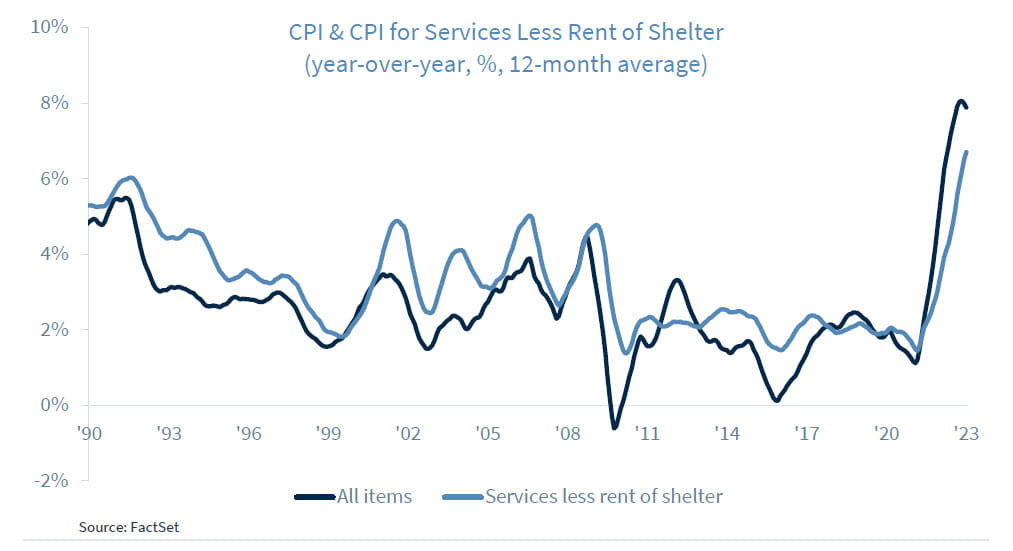
However, if we look at the 12-month average CPI for services less rent of shelter, it hasn’t started to come back down (graph below), which is consistent with what the Fed Chairman argued during his press conference. The 12-month average for overall CPI has just started to come back down according to the definition of inflation given by the Fed, as shown in the graph below, but that is not the case for the CPI for services less rent of shelter. This is the reason we believe that the road ahead is going to be longer than what markets have been expecting and that the Fed is going to take longer to start lowering interest rates that what has been priced by the markets.
The biggest issue for the Fed today is that it still needs to convince the markets that it is serious about what it needs to do and how long it will take because easier monetary conditions, as we have started to see during the previous months, will not make the Fed’s job easier.
Economic and market conditions are subject to change.
Opinions are those of Investment Strategy and not necessarily those of Raymond James and are subject to change without notice. The information has been obtained from sources considered to be reliable, but we do not guarantee that the foregoing material is accurate or complete. There is no assurance any of the trends mentioned will continue or forecasts will occur. Last performance may not be indicative of future results.
Consumer Price Index is a measure of inflation compiled by the U.S. Bureau of Labor Statistics. Currencies investing is generally considered speculative because of the significant potential for investment loss. Their markets are likely to be volatile and there may be sharp price fluctuations even during periods when prices overall are rising.
Consumer Sentiment is a consumer confidence index published monthly by the University of Michigan. The index is normalized to have a value of 100 in the first quarter of 1966. Each month at least 500 telephone interviews are conducted of a contiguous United States sample.
Personal Consumption Expenditures Price Index (PCE): The PCE is a measure of the prices that people living in the United States, or those buying on their behalf, pay for goods and services. The change in the PCE price index is known for capturing inflation (or deflation) across a wide range of consumer expenses and reflecting changes in consumer behavior.
The Consumer Confidence Index (CCI) is a survey, administered by The Conference Board, that measures how optimistic or pessimistic consumers are regarding their expected financial situation. A value above 100 signals a boost in the consumers’ confidence towards the future economic situation, as a consequence of which they are less prone to save, and more inclined to consume. The opposite applies to values under 100.
Leading Economic Index: The Conference Board Leading Economic Index is an American economic leading indicator intended to forecast future economic activity. It is calculated by The Conference Board, a non- governmental organization, which determines the value of the index from the values of ten key variables
Certified Financial Planner Board of Standards Inc. owns the certification marks CFP®, Certified Financial Planner™, CFP® (with plaque design) and CFP® (with flame design) in the U.S., which it awards to individuals who successfully complete CFP Board’s initial and ongoing certification requirements.
Links are being provided for information purposes only. Raymond James is not affiliated with and does not endorse, authorize or sponsor any of the listed websites or their respective sponsors. Raymond James is not responsible for the content of any website or the collection or use of information regarding any website’s users and/or members.
GDP Price Index: A measure of inflation in the prices of goods and services produced in the United States. The gross domestic product price index includes the prices of U.S. goods and services exported to other countries. The prices that Americans pay for imports aren’t part of this index.
FHFA House Price Index: The FHFA House Price Index is the nation’s only collection of public, freely available house price indexes that measure changes in single-family home values based on data from all 50 states and over 400 American cities that extend back to the mid-1970s.
Expectations Index: The Expectations Index is a component of the Consumer Confidence Index® (CCI), which is published each month by the Conference Board. The CCI reflects consumers’ short-term—that is, six- month—outlook for, and sentiment about, the performance of the overall economy as it affects them.
Present Situation Index: The Present Situation Index is an indicator of consumer sentiment about current business and job market conditions. Combined with the Expectations Index, the Present Situation Index makes up the monthly Consumer Confidence Index.
Pending Home Sales Index: The Pending Home Sales Index (PHS), a leading indicator of housing activity, measures housing contract activity, and is based on signed real estate contracts for existing single-family homes, condos, and co-ops. Because a home goes under contract a month or two before it is sold, the Pending Home Sales Index generally leads Existing-Home Sales by a month or two.
DISCLOSURES
Import Price Index: The import price index measure price changes in goods or services purchased from abroad by
U.S. residents (imports) and sold to foreign buyers (exports). The indexes are updated once a month by the Bureau of Labor Statistics (BLS) International Price Program (IPP).
ISM New Orders Index: ISM New Order Index shows the number of new orders from customers of manufacturing firms reported by survey respondents compared to the previous month.ISM Employment Index: The ISM Manufacturing Employment Index is a component of the Manufacturing Purchasing Managers Index and reflects employment changes from industrial companies.
ISM Inventories Index: The ISM manufacturing index is a composite index that gives equal weighting to new orders, production, employment, supplier deliveries, and inventories.
ISM Production Index: The ISM manufacturing index or PMI measures the change in production levels across the
U.S. economy from month to month.
ISM Services PMI Index: The Institute of Supply Management (ISM) Non-Manufacturing Purchasing Managers’ Index (PMI) (also known as the ISM Services PMI) report on Business, a composite index is calculated as an indicator of the overall economic condition for the non-manufacturing sector.
Source: FactSet, data as of 12/29/2022
Markets & Investing Members of the Raymond James Investment Strategy Committee share their views on...
Markets & Investing Review the latest Weekly Headings by CIO Larry Adam. Key Takeaways ...
Technology & Innovation Learn about a few simple things you can do to protect your personal information...