Chief Economist Eugenio J. Alemán discusses current economic conditions.
If we stop and think what happened this week just by reading the result of GDP growth for the second quarter, we would probably conclude that the US economy was in a recession during the first half of the year, but is now coming out of it. This is probably what a Martian dropping into the Earth would say after looking at the GDP report. Why? Because according to the GDP report, the economy declined by 1.6% during the first quarter of the year and then it ‘only’ declined by 0.9% during the second quarter of the year. Thus, his/her conclusion would be: Oh, the economy is improving, as it posted a better rate of growth in the second quarter than in the first quarter!
But we know that this is nonsense. The US economy was actually weaker in the second quarter of the year than in the first quarter of the year, no matter what the GDP report says. This is the reason many economists say that the first quarter GDP result was a fluke, and it cannot be counted as the start of a recession, assuming we take, for the sake of this example, the definition of a recession as two consecutive quarters of negative growth.
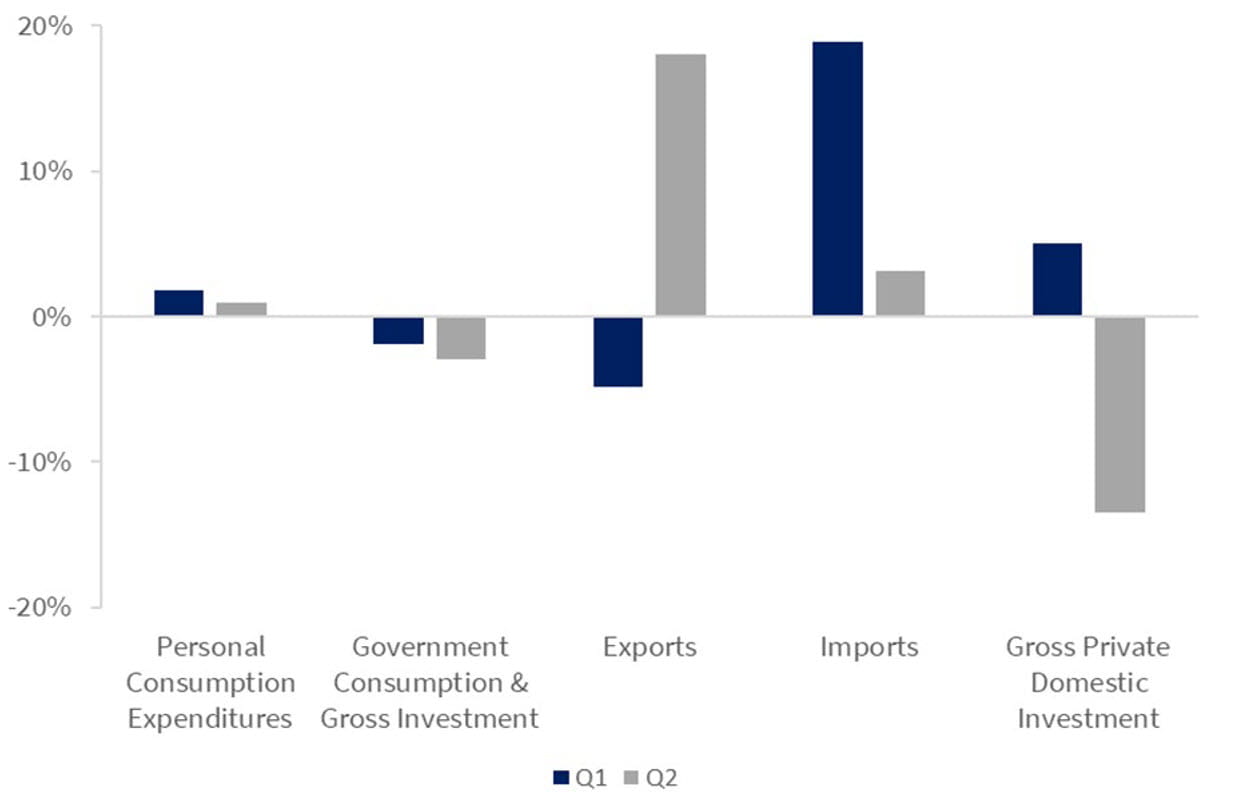
Thus, we have said over the last several months that the first quarter GDP result was a fluke. But what about the second quarter result? Well, that’s a very different story. The second quarter result is a clear indication that the economy has weakened considerably. That’s because personal consumption expenditures, which increased by 1.8% during the first quarter of the year, only increased by 1.0% during the second quarter of the year.
Meanwhile, investment, or gross private domestic investment, increased by 5.0% during the first quarter of the year but plunged by 13.5% during the second quarter of the year. Meanwhile, exports of goods and services declined 4.8% during the first quarter of the year but surged by 18.0% during the second quarter of the year. Imports, on the other hand, which enter the calculation of GDP growth with a negative sign, surged 18.9% during the first quarter of the year while increasing by only 3.1% during the second quarter of the year. In fact, the surge in imports of goods and services during the first quarter of the year is what made the first quarter GDP result a ‘fluke!’
The decline in GDP reported for the second quarter, if sustained (this is just the first estimate for Q2 GDP), could be the starting point of a recession. We did not experience a recession in the first quarter of the year. However, we could be close to a recession if, as we expect, the US economy continues to weaken from here.
What is the NAIRU?
The NAIRU is something we will hear a lot about for the next year or so. It is a catchy term and a tool in economists’ toolkits that, today, will be useful to explain what seems to be happening at the Federal Reserve (Fed) that may push it to increase interest rates too much to try to bring inflation down. We haven’t heard about this concept for several decades because inflation has not been a serious issue since the 1990s. However, we have read several analysts/economists that argue that Fed officials’ “reaction function” seems to be pivoting to a NAIRU explanation of the origins of today’s rate of inflation. And if this is the case, then it is not good.
Let us take a look at the technical aspects of the NAIRU first. The NAIRU stands for the Non-Accelerating Inflation Rate of Unemployment. That is, NAIRU is a fancy way of saying that if inflation is increasing, then it must be that the rate of unemployment is too low.
This is not good because thinking that today’s unemployment rate is too low for maintaining price stability means that the Fed may want to increase the rate of unemployment. The biggest issue with the NAIRU is that nobody knows what the NAIRU is at any point in time. It is not fixed, it’s a moving target. However, we have had very low rates of unemployment before with very low rates of inflation. What has happened today that would prompt the Fed to start speculating that the NAIRU may have changed, that is, now the NAIRU may be higher, closer to 5% or 6% as we have been hearing and reading?
Furthermore, the only reason the unemployment rate is so low today is because the labor force participation rate is too low, and firms seem to be increasing wages and benefits in order to attract more people into the labor force and/or competing with other firms to bid away their workers. In any event, we believe that targeting the rate of unemployment, if that is what the Fed may be ready to do, is a very bad decision because it may make it increase the federal funds rate too much and risk sending the economy into a deeper recession.
The Fed has recognized that the Russian/Ukraine war and issues with supply chain imbalances are at the root of why inflation is so high today. It is true that fiscal policy was the culprit for inflation at the beginning of this process, but those effects have been flushed out already. Failing to recognize this and blaming the tightness of the labor market seems to be the incorrect approach to solving the inflation problem today.
The Federal Reserve Decision
This brings us to the Fed decision to increase the federal funds rate on July 27, 2022. There was no surprise here as markets had anticipated the Fed’s move to increase the federal funds rate by another 75 bps. Clearly, markets were happy with the decision, and they rallied after it was announced.
In general, the statement by the Fed included nothing markets were not expecting. However, the press conference by Chairman Powell after the decision was announced raised some questions that are a bit concerning. The most concerning of his comments was that the labor market remained too tight for price stability and that a further strong increase in the federal funds rate may be needed. Furthermore, he also said that we needed to get economic growth below potential for some time to give the supply side of the economy time to recover and thus bring inflation down.
We believe that the Fed will increase the federal funds rate by another 50 bps during its September meeting and by another 50 bps during the December meeting. However, they indicated that they are open to making changes based on incoming data. The part of the commentary that was concerning was this idea that the “labor market remained too tight for price stability.”
What does the “labor market remains too tight for price stability” mean? Does it mean that it needs to bring the unemployment rate up no matter what? There are two ways to bring the unemployment rate up. The first one is through an increase in the labor force participation rate. If Americans decide to reengage in the economy in the coming months and start looking for jobs, an increase in the labor force participation rate will increase the unemployment rate, all else constant. However, the Fed has no control over the individual decision of Americans to come back to the labor force.
This means that it is talking about a second way of increasing the rate of unemployment, one that is fully under its control. That is, increase the federal funds rate so much as to generate a recession. However, we are talking about a true recession, not the one that ‘did not occur’ during the first half of this year, which created 2.74 million jobs during the first six months of the year at a monthly average of 457 thousand jobs per month. No, what this statement is suggesting is that they will do what is necessary so the economy starts to destroy jobs, which will also increase the rate of unemployment (see previous section where we discuss the NAIRU).
We understand that the Fed has two fundamental mandates, price stability and low unemployment. However, Chairman Powell’s commentary seems to be pivoting to just one mandate, that of price stability. And having a correct understanding of why inflation is so high today is very important so the Fed can prescribe the correct medicine for the continued health of the US economy.
Economic and market conditions are subject to change.
Opinions are those of Investment Strategy and not necessarily those Raymond James and are subject to change without notice the information has been obtained from sources considered to be reliable, but we do not guarantee that the foregoing material is accurate or complete. There is no assurance any of the trends mentioned will continue or forecasts will occur last performance may not be indicative of future results.
Consumer Price Index is a measure of inflation compiled by the US Bureau of Labor Studies. Currencies investing are generally considered speculative because of the significant potential for investment loss. Their markets are likely to be volatile and there may be sharp price fluctuations even during periods when prices overall are rising.
Consumer Sentiment is a consumer confidence index published monthly by the University of Michigan. The index is normalized to have a value of 100 in the first quarter of 1966. Each month at least 500 telephone interviews are conducted of a contiguous United States sample.
The producer price index is a price index that measures the average changes in prices received by domestic producers for their output. Its importance is being undermined by the steady decline in manufactured goods as a share of spending.
Industrial production: Industrial and production engineering is a measure of output of the industrial sector of the economy. The industrial sector includes manufacturing, mining, and utilities.
Personal Consumption Expenditures Price Index (PCE): The PCE is a measure of the prices that people living in the United States, or those buying on their behalf, pay for goods and services. The change in the PCE price index is known for capturing inflation (or deflation) across a wide range of consumer expenses and reflecting changes in consumer behavior.
FHFA house price index is a quarterly index that measures average changes in housing prices based on sales or refinancing’s of single-family homes whose mortgages have been purchased or securitized by Fannie Mae or Freddie Mac.
Consumer confidence index is an economic indicator published by various organizations in several countries. In simple terms, increased consumer confidence indicates economic growth in which consumers are spending money, indicating higher consumption.
ISM Manufacturing indexes are economic indicators derived from monthly surveys of private sector companies.
ISM Services Index is an economic index based on surveys of more than 400 non-manufacturing (or services) firms’ purchasing and supply executives.
Non-Manufacturing Business Activity Index is a seasonally adjusted index released by the Institute for Supply Management measuring business activity and conditions in the United States service economy as part of the Non-Manufacturing ISM Report on Business.
New orders index measures the value of the orders received in the course of the month by French companies with over 20 employees in the manufacturing industries working on orders.
Source: FactSet, data as of 6/3/2022
Markets & Investing Members of the Raymond James Investment Strategy Committee share their views on...
Markets & Investing Review the latest Weekly Headings by CIO Larry Adam. Key Takeaways ...
Technology & Innovation Learn about a few simple things you can do to protect your personal information...