Drew O’Neil discusses fixed income market conditions and offers insight for bond investors.
Intermediate and Long Treasury Yields Trending Higher
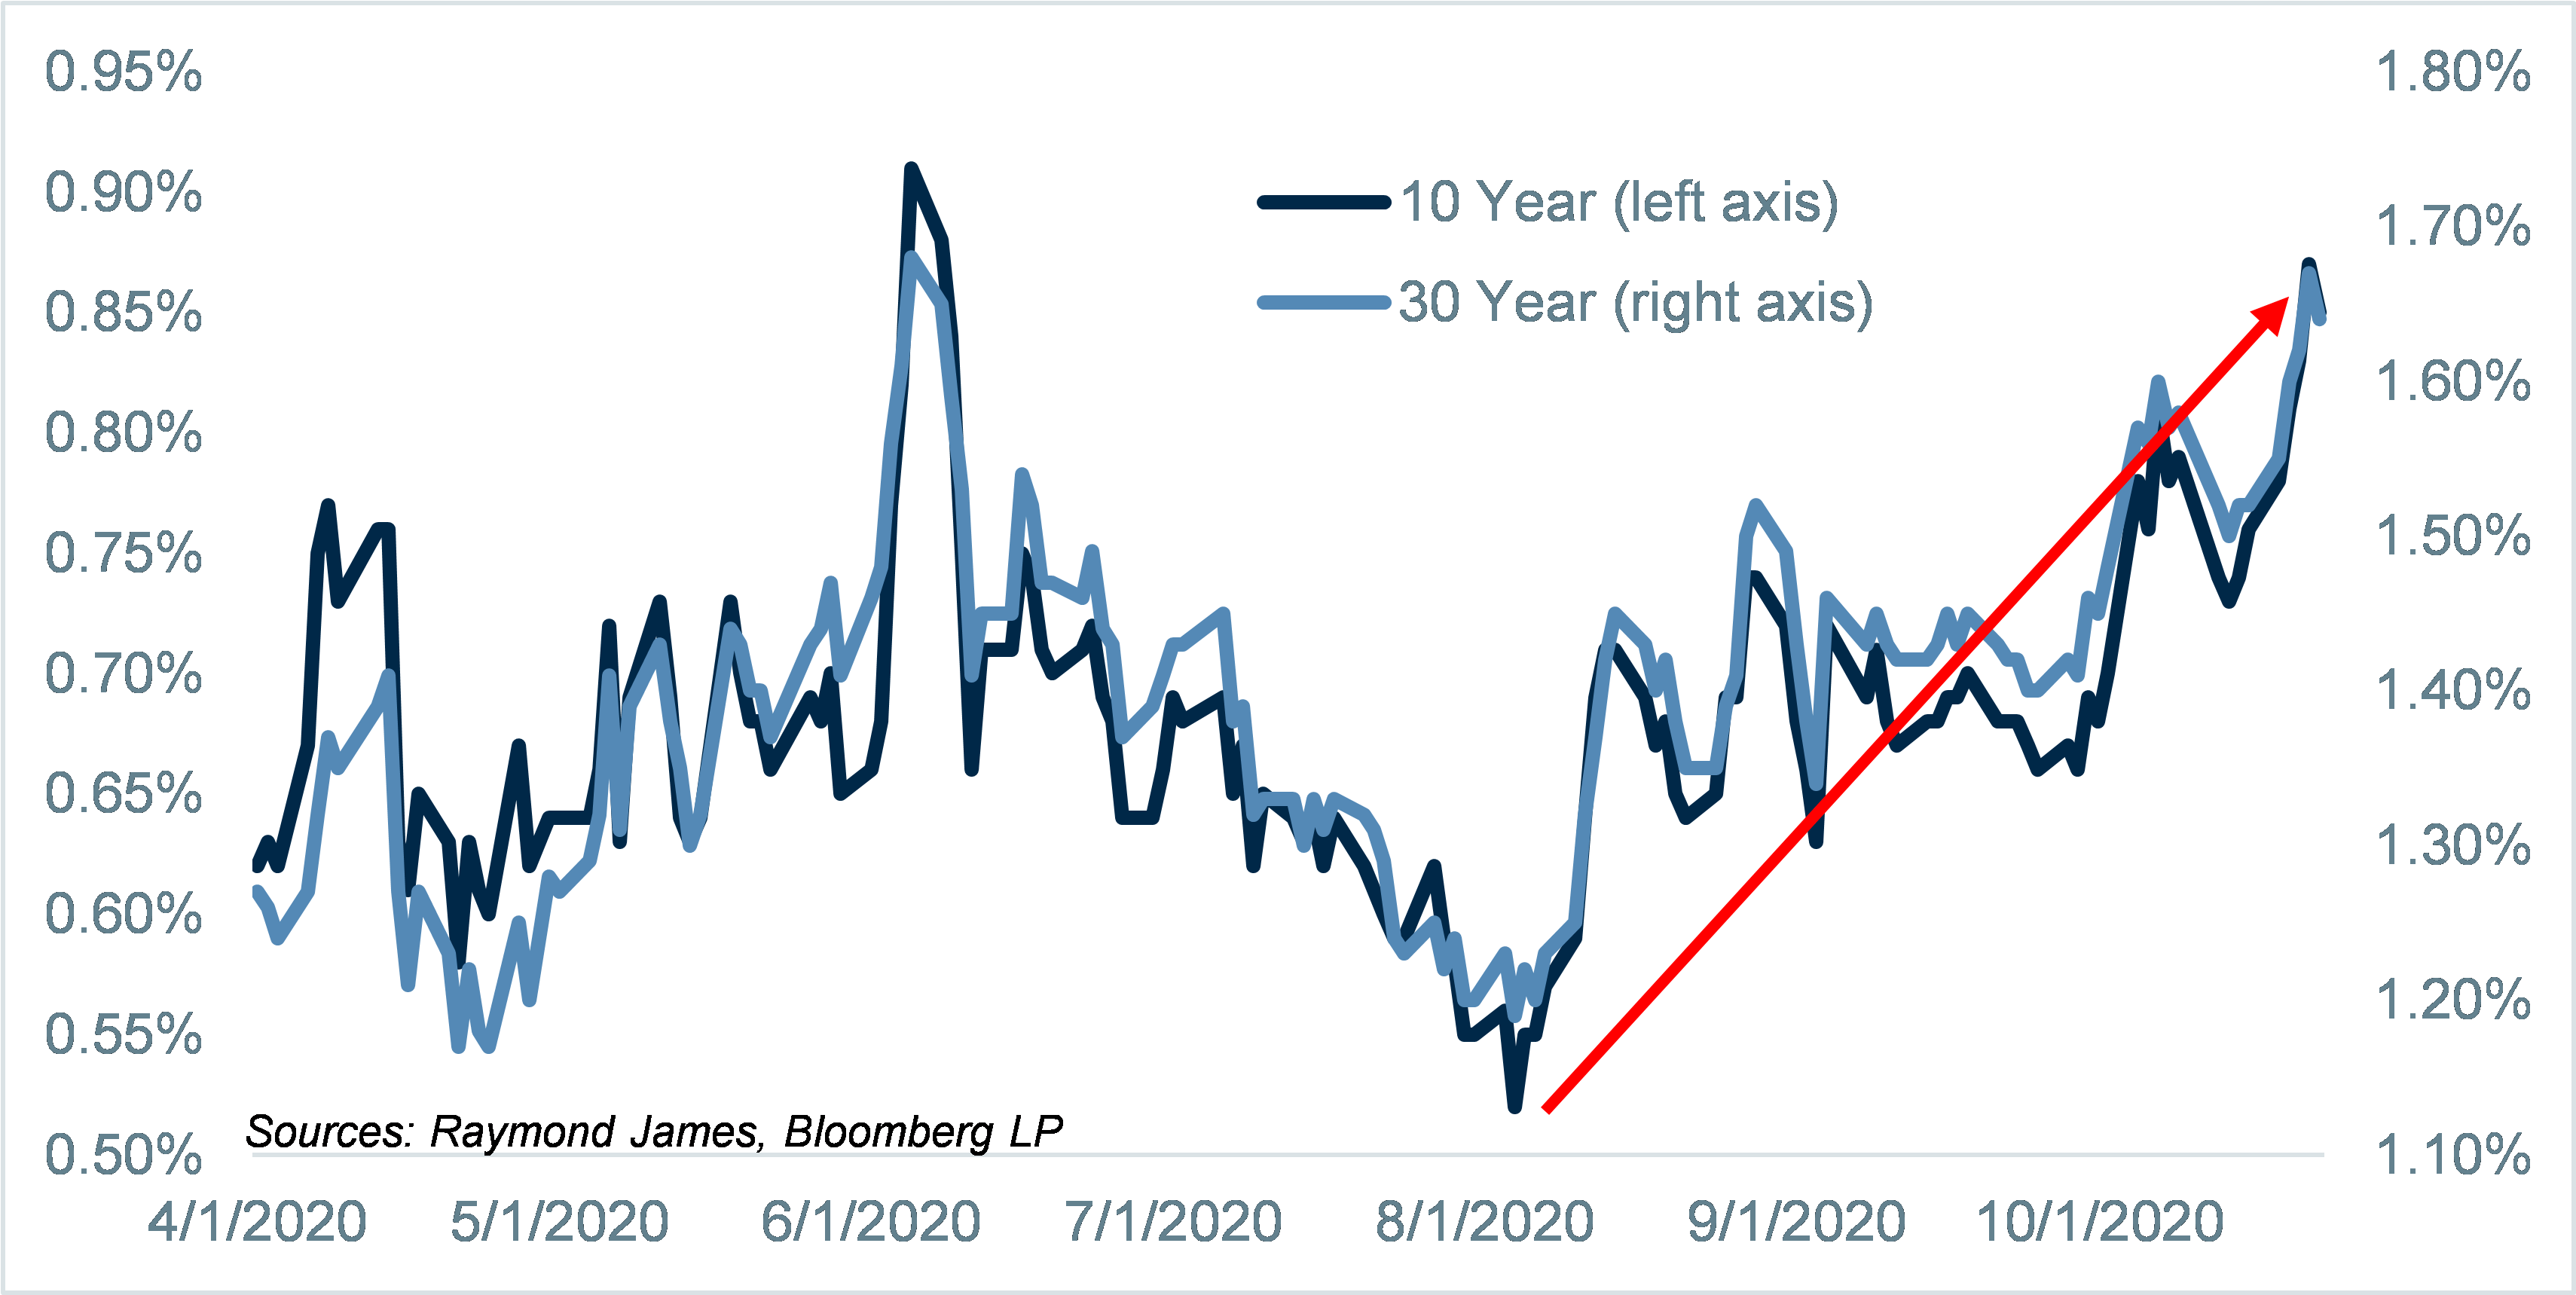
This graph shows 10 and 30 year Treasury yields since April, which is when the extreme market volatility that we experienced earlier in the year began to subside. Since the yields bottomed in early August, the overall trend has clearly been towards higher yields. Whether this is the start of a longer term trend or just a short-term move is up for debate, but the recent trend is clear.
Treasury Curve Steepening
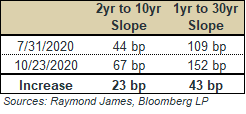
While intermediate and long Treasury yields have been on the move, the short end of the curve has seen very little movement. Since the start of August, the 1-year Treasury has remained in a tight range of 12-15 basis points. This is not unexpected, as the FOMC has made clear their intention of keeping short-term yields low for the foreseeable future. The net effect of the FOMC’s hold on short-term yields and higher longer-term yields has been a steeper yield curve over the past few months, as highlighted in the chart above. A steeper yield curve presents an opportunity for investors, as it means more reward (yield) for extending out farther on the yield curve. As an example, as of Friday, the Bloomberg BBB Corporate Bond Index provided investors just over 1.00% in additional yield by extending from a 2-year bond to a 7-year bond.
Tax-Exempt Municipal Yields Inching Higher As Well
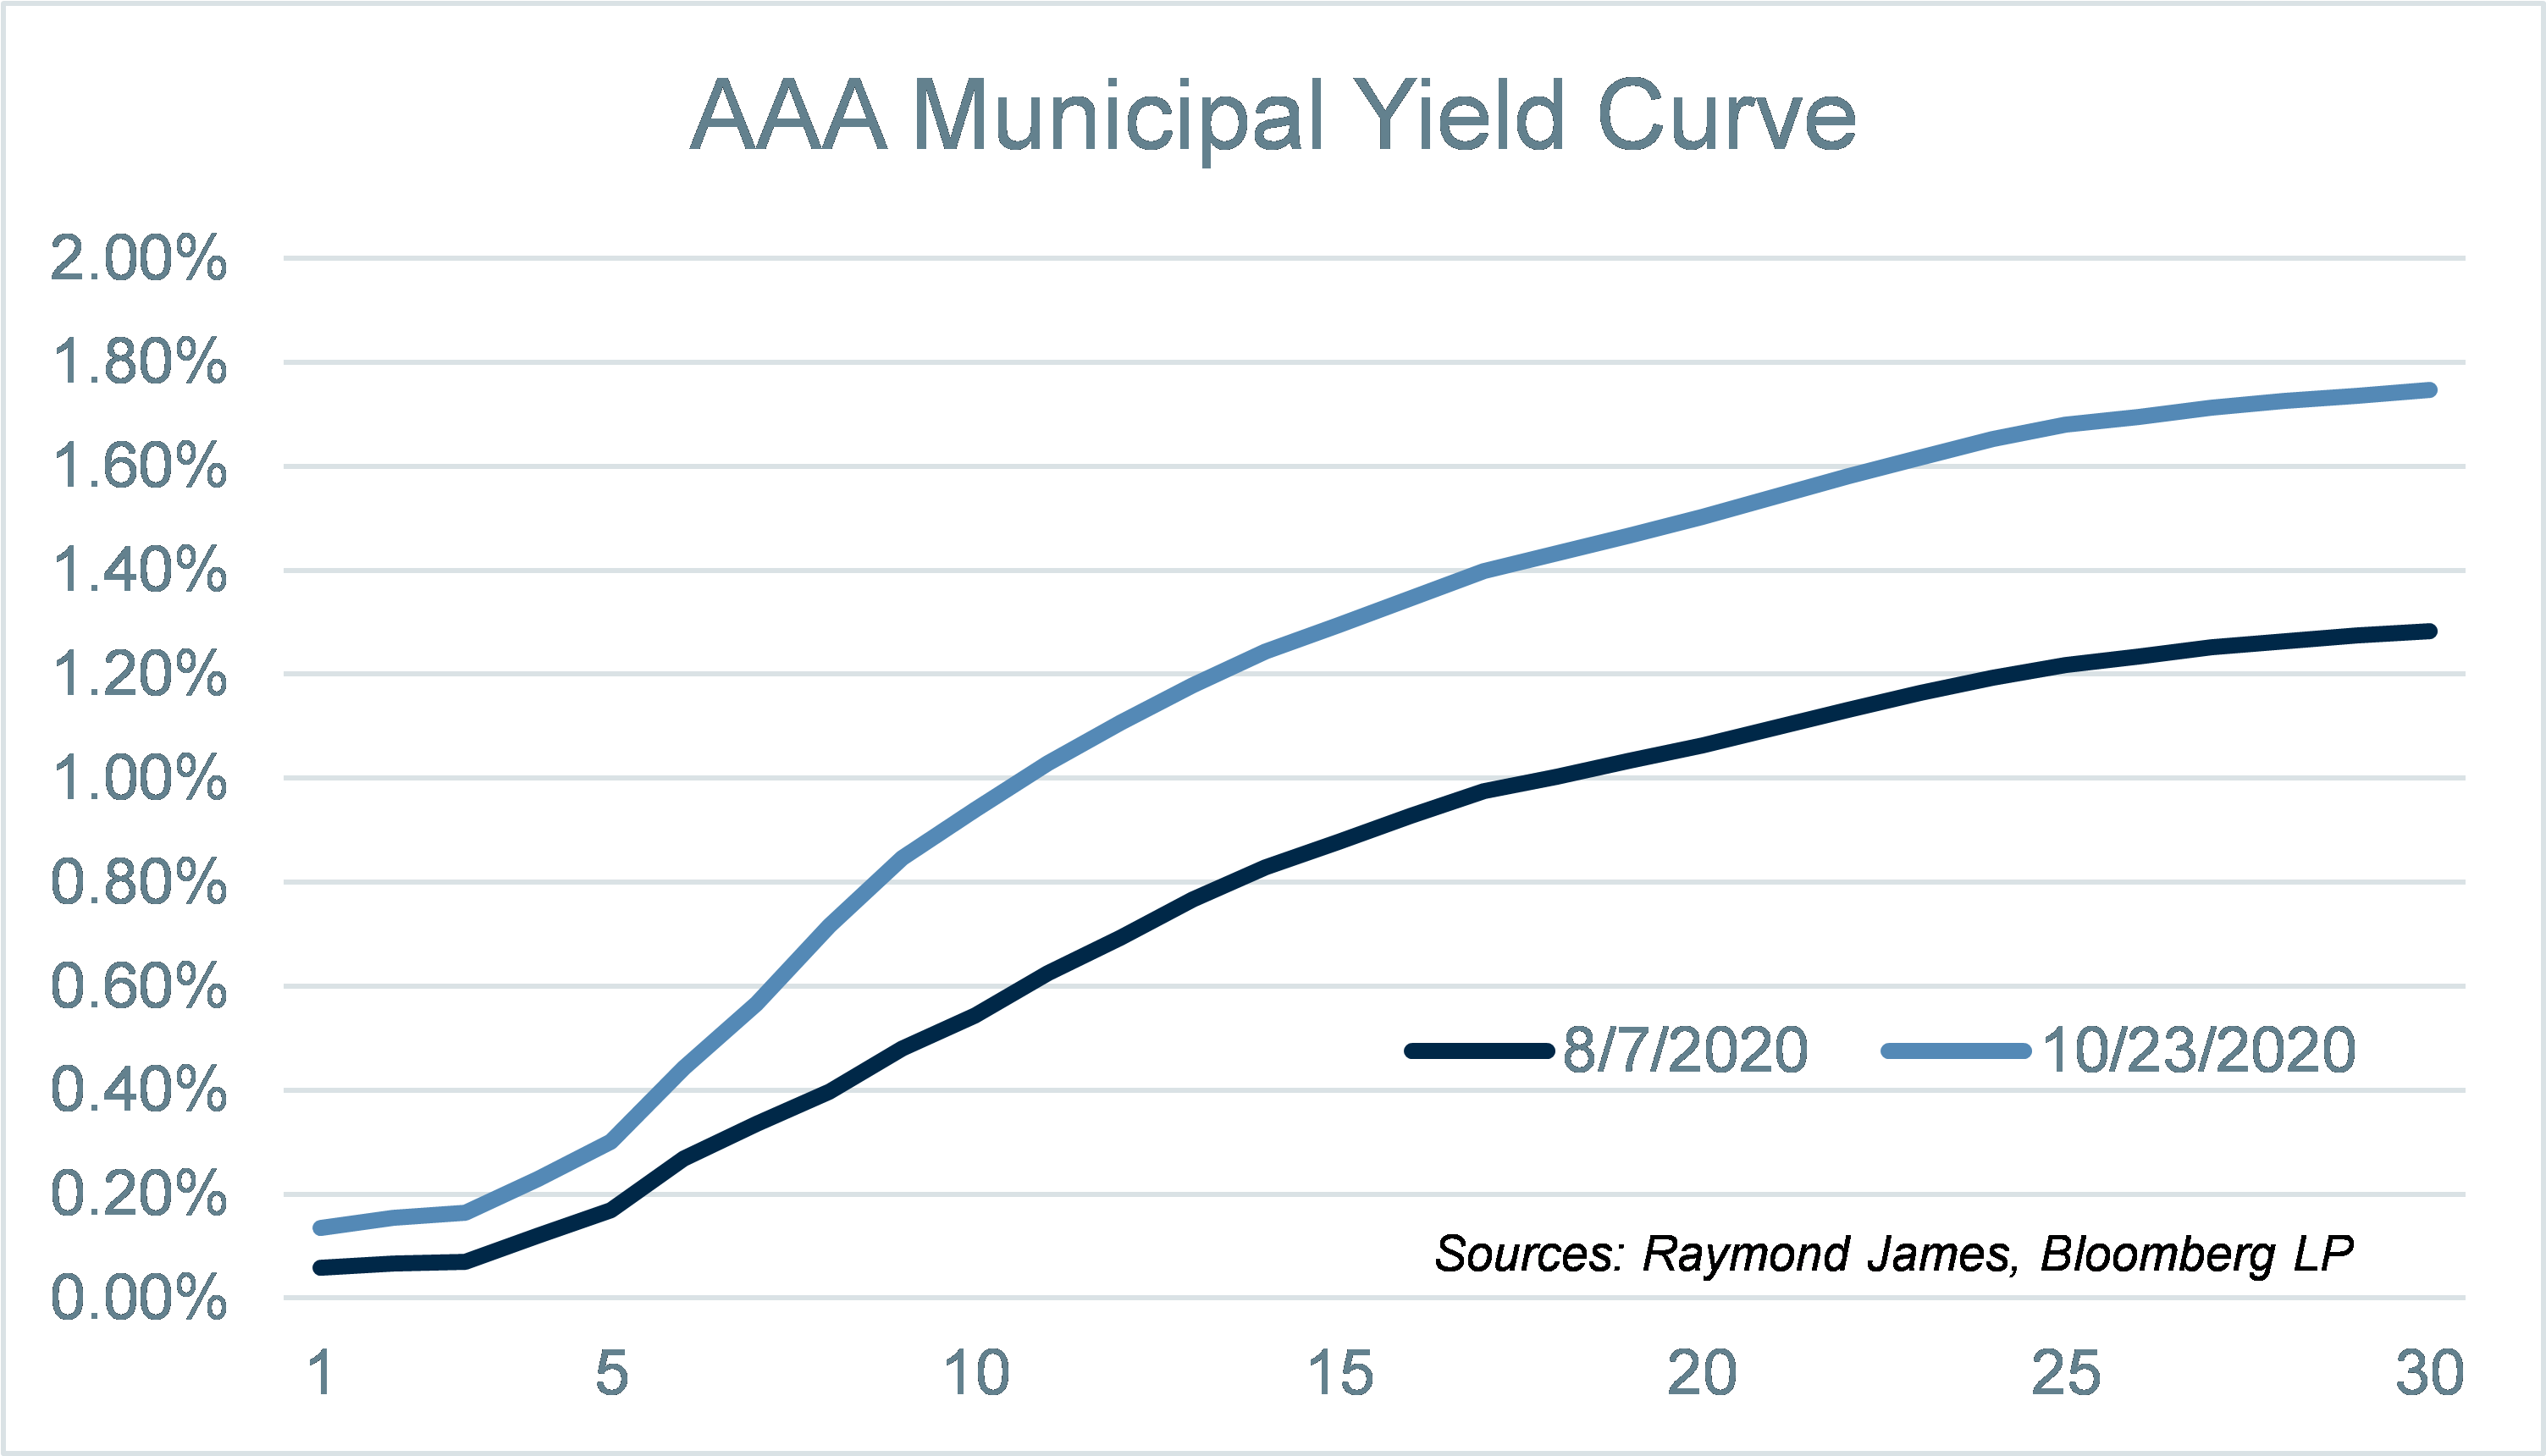
It took a little longer for the volatility in municipal bonds to subside compared to taxable bonds, but since late May, municipal yields have stabilized relative to the extreme movement experienced in March and April. Similar to the trend discussed above for Treasuries, municipal yields bottomed in early August and have been trending higher recently. In addition to higher yields, the municipal curve has also been steepening, with the slope (as measured by the 1 to 30 year spread) increasing from 122 to 161 basis points from August 7th to October 23rd (depicted on the graph above).
Corporate Bond Spreads Remain Stable

Massive fund outflows, among other factors, contributed to spread widening in the corporate bond market earlier this year. Spreads peaked in late March and drove steadily tighter through the end of July. Over the past few months, corporate spreads have been relatively stable, remaining in a fairly tight range as can be seen in the chart above. The stability in corporate bond spreads combined with the increases in Treasury yields over the past couple of months have led to higher corporate bond yields (a corporate bond’s yield is the corresponding Treasury’s yield plus the spread). The yield of the 10-year BBB corporate bond index has risen from a low of 1.92% in early August to 2.23% as of Friday’s close, an increase of over 30 basis points. As stated earlier, whether this increase in yields is permanent or temporary is yet to be determined, but for investors with money to put to work, the recent trends higher in yield could be the motivation enticing investors off the sidelines and back into the market.
To learn more about the risks and rewards of investing in fixed income, please access the Securities Industry and Financial Markets Association’s “Learn More” section of investinginbonds.com, FINRA’s “Smart Bond Investing” section of finra.org, and the Municipal Securities Rulemaking Board’s (MSRB) Electronic Municipal Market Access System (EMMA) “Education Center” section of emma.msrb.org.
The author of this material is a Trader in the Fixed Income Department of Raymond James & Associates (RJA), and is not an Analyst. Any opinions expressed may differ from opinions expressed by other departments of RJA, including our Equity Research Department, and are subject to change without notice. The data and information contained herein was obtained from sources considered to be reliable, but RJA does not guarantee its accuracy and/or completeness. Neither the information nor any opinions expressed constitute a solicitation for the purchase or sale of any security referred to herein. This material may include analysis of sectors, securities and/or derivatives that RJA may have positions, long or short, held proprietarily. RJA or its affiliates may execute transactions which may not be consistent with the report’s conclusions. RJA may also have performed investment banking services for the issuers of such securities. Investors should discuss the risks inherent in bonds with their Raymond James Financial Advisor. Risks include, but are not limited to, changes in interest rates, liquidity, credit quality, volatility, and duration. Past performance is no assurance of future results.
Stocks are appropriate for investors who have a more aggressive investment objective, since they fluctuate in value and involve risks including the possible loss of capital. Dividends will fluctuate and are not guaranteed. Prior to making an investment decision, please consult with your financial advisor about your individual situation.
Markets & Investing Members of the Raymond James Investment Strategy Committee share their views on...
Markets & Investing Review the latest Weekly Headings by CIO Larry Adam. Key Takeaways ...
Technology & Innovation Learn about a few simple things you can do to protect your personal information...