Doug Drabik discusses fixed income market conditions and offers insight for bond investors.
Volatility in the marketplace has understandingly raised uncertainty as to how the markets may react going forward. There are many distinct differences between equities and bonds and these characteristics shape investment portfolio performance. Equities are part of the growth allocation which over time can expectantly provide meaningful increases in wealth. Bonds may likely experience less growth during good times but also less decline during difficult times. Individual bonds may anchor portfolios by protecting the accumulated wealth and providing known cash flow, known income and a specific date when face value is returned. Principal protection is often the primary purpose but income earned is a desirable secondary benefit. Current market volatility has shifted yield curves into positions of benefit in terms of yield/income earned for investors. How long this favorable position will last is yet another unknown.
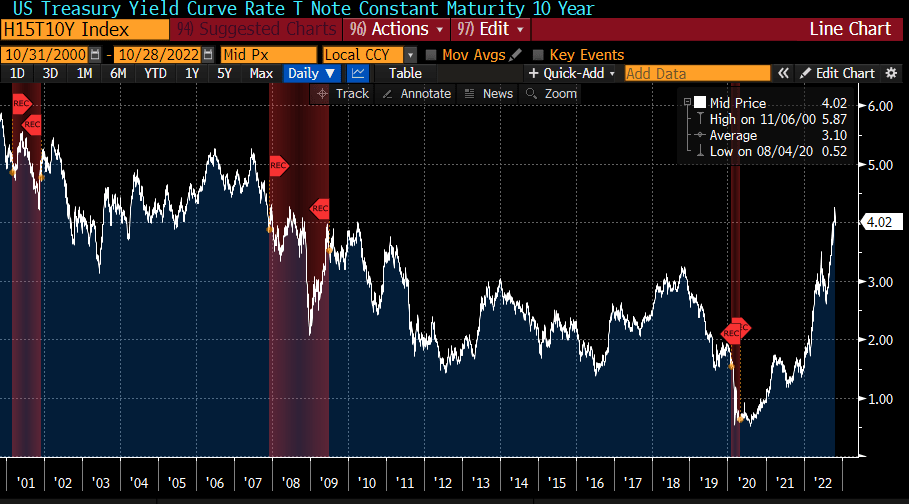
This graph shows the 10 year Treasury yield (white line) and illustrates that during the last three recessions (red shading), it experienced a general decline in rates through the recessionary period. This is not surprising when you consider that an economic slowdown in business production will entice the Federal Reserve to attempt to stimulate growth. This is often attempted by making monetary policy more accommodative with lower rates. Lower interest rates may provide an incentive to individuals and businesses to borrow money and/or invest in people and products. Recognizing where the economic cycle is, whether in expansion or recession, may provide clues as to the near future rate environment.
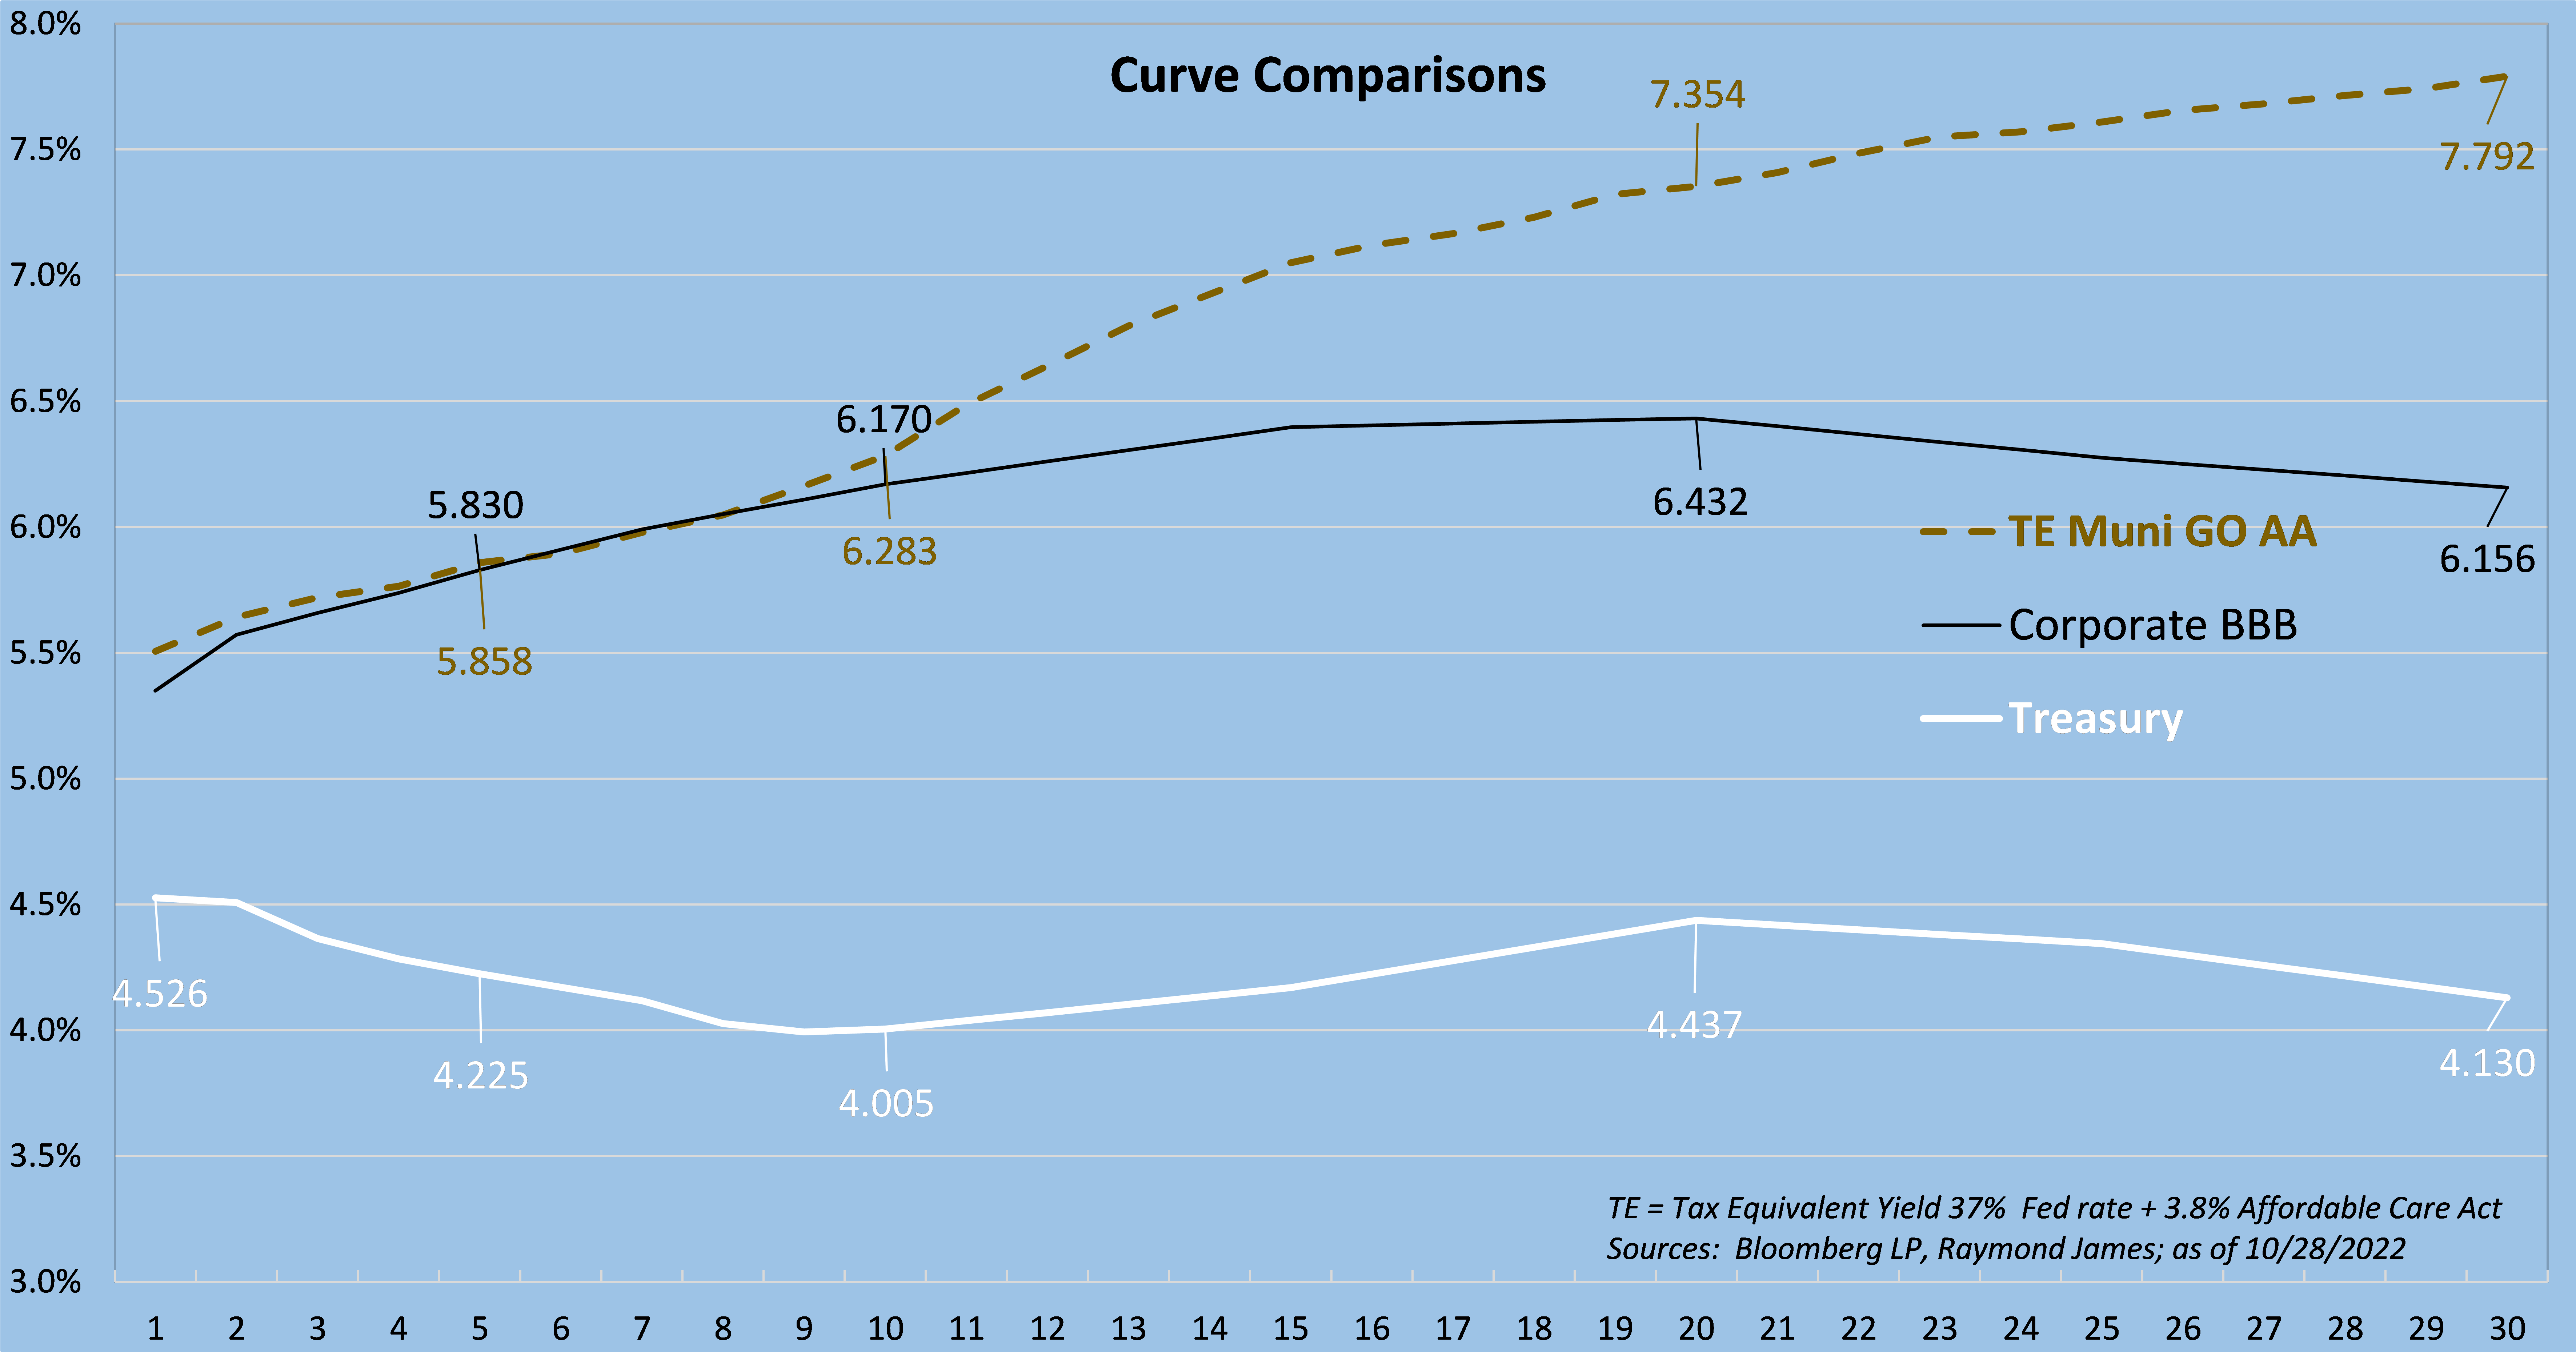
The following graph depicts where several yield curves are as of now. Several key traits are noteworthy. When the populace speaks of “the curve,” generally they are referring to the Treasury curve (white line). The Treasury curve rates are elevated to levels much higher than we’ve seen in years. More to the point, the yield curves that coincide with typical portfolio composition, the corporate curve (black line) and the municipal curve (dashed gold line) exhibit not only greater rates but also steeper slopes. What this means to investors is that individual bonds continue to provide principal protection and in addition, income that hasn’t been obtainable in a long time. Investment grade individual bonds with modest durations can provide tax equivalent yields in a range of 5.5% to north of 7.0% in today’s environment. Considering that the average annual total return of the S&P 500 index (growth asset) since the turn of the century has been ~6.36%, this appears to be an ideal time to shore up the fixed income allocation of your investment portfolio where principal protective qualities are met with historically excellent yields.
The author of this material is a Trader in the Fixed Income Department of Raymond James & Associates (RJA), and is not an Analyst. Any opinions expressed may differ from opinions expressed by other departments of RJA, including our Equity Research Department, and are subject to change without notice. The data and information contained herein was obtained from sources considered to be reliable, but RJA does not guarantee its accuracy and/or completeness. Neither the information nor any opinions expressed constitute a solicitation for the purchase or sale of any security referred to herein. This material may include analysis of sectors, securities and/or derivatives that RJA may have positions, long or short, held proprietarily. RJA or its affiliates may execute transactions which may not be consistent with the report’s conclusions. RJA may also have performed investment banking services for the issuers of such securities. Investors should discuss the risks inherent in bonds with their Raymond James Financial Advisor. Risks include, but are not limited to, changes in interest rates, liquidity, credit quality, volatility, and duration. Past performance is no assurance of future results.
Investment products are: not deposits, not FDIC/NCUA insured, not insured by any government agency, not bank guaranteed, subject to risk and may lose value.
To learn more about the risks and rewards of investing in fixed income, access the Securities Industry and Financial Markets Association’s Project Invested website and Investor Guides at www.projectinvested.com/category/investor-guides, FINRA’s Investor section of finra.org, and the Municipal Securities Rulemaking Board’s (MSRB) Electronic Municipal Market Access System (EMMA) at emma.msrb.org.
Markets & Investing Members of the Raymond James Investment Strategy Committee share their views on...
Markets & Investing Review the latest Weekly Headings by CIO Larry Adam. Key Takeaways ...
Technology & Innovation Learn about a few simple things you can do to protect your personal information...