Chief Economist Eugenio J. Alemán discusses current economic conditions.
July’s inflation numbers were the best news the US economy has had for a long time. Both the Consumer Price Index (CPI) and the Producer Price Index (PPI) showed better than expected prints, with 0% for the CPI month-over-month and 8.5% year-over-year and -0.5% for the PPI month-over-month and 9.8% on a year-earlier basis. Of course, these numbers are just one month after a grueling half year but could be pointing to a better start for the second half of the year.
However, it is also true that much lower energy prices (e.g., lower gasoline prices) were the biggest reason for the better-than-expected number in July for both indices. I know that there are plenty of economists/analysts out there that always like to look at the glass half empty, so we normally place ourselves on the ‘not-so-followed path’ of trying to look at the glass half full.
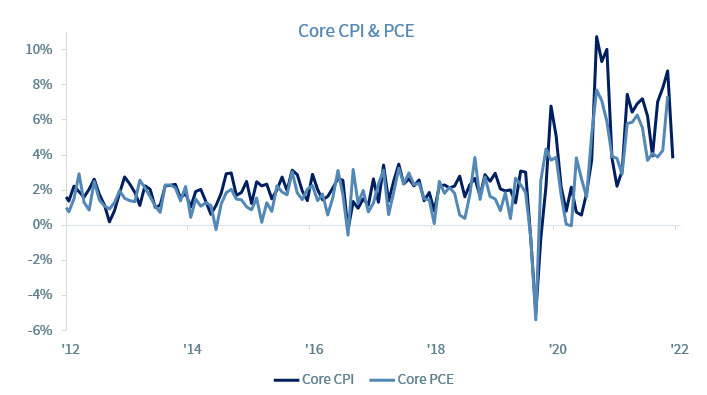
Thus, the most important number from the CPI report wasn’t the overall number, which includes energy prices; the most important number in July was the core CPI, which does not include energy or food prices, and increased by only 0.3%, the lowest monthly increase since March of this year when it was also 0.3%. This number is crucial for the Federal Reserve (Fed) and if we continue to see low numbers for the core CPI, it will reduce the pressure on the institution to increase the federal funds too much and too fast.
The Fed needs to see clear indications that even if energy and food prices go up, this increase in energy and food prices is not seeping through to the core numbers. If this is the case in the next several months, then the Fed may rethink its interest rate increases going forward.
However, this path is full of risks for Fed officials because there is nothing they can do to prevent potentially higher energy and food prices in the future, so they may have to ‘play it safe’ and go ahead with a higher increase in interest rates than we expect, which is 50 basis points during the September meeting. Thus, the PCE price index, but especially the PCE price index excluding food and energy, released later this month, will be a very important indicator of inflation, even better than the CPI number released this week.
Why is Inflation So Damaging?
Inflation has not been this high for about 40 years or so. Thus, for many Americans, this is the first time they are facing such high inflation and younger generations are probably struggling with what to do about it. Furthermore, while older generations have more experience with high inflation many of them are on fixed incomes because they are retired, and they are suffering the most from higher prices. Thus, it is obvious that inflation would be front and center in today’s political discourse.
Furthermore, higher inflation is very trying for all Americans but particularly for those in the lower income levels who, in normal times, struggle to get by from month to month and higher prices are putting an added burden on their ability to get to the end of the month.
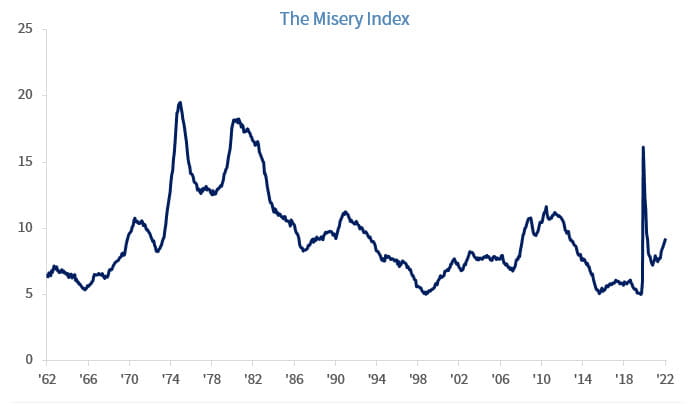
For the Fed, keeping inflation low and stable is one of the institution’s two mandates. The other mandate is keeping the rate of unemployment low. The later mandate is not at issue today. The US unemployment rate declined to 3.5% in July, matching the rate recorded just before the start of the COVID-19 pandemic and the lowest rate in more than 50 years. During the 1970s and 1980s, the rate of unemployment and the rate of inflation was so high that economists coined a term called the ‘misery index,’ which is calculated by summing the rate of inflation and the rate of unemployment.
Today, the misery index has been going up because of the increase in inflation but the very low rate of unemployment is keeping it from surging past previous periods, especially the periods of the 1970s and 1980s, which were called the years of ‘Stagflation’ (See the June 10, 2022, Weekly Economics for more on Stagflation).
However, this could change very quickly if firms decide to start massively laying off workers because they fear the US economy is heading towards a recession. So far, this hasn’t happened, as demonstrated by the blockbuster July nonfarm employment number, up 528,000 new jobs during the month.
But the biggest issue for the Fed is deciding what is its primary objective and currently, that objective is, clearly, to bring inflation down. However, the dual mandate for the Fed is very tricky because in normal times, the rate of unemployment and the rate of inflation go in opposite directions. That is, if the rate of unemployment is too low, the rate of inflation is normally pushed higher.
Having said this, the US economy has enjoyed very low rates of inflation over the last 30 years alongside very low rates of unemployment. So, today, the question for the Fed is, will the US economy go back to pre-COVID times during which we had a very low rate of unemployment alongside a very low rate of inflation or have times changed again and are we going back to the 1970s and 1980s?
There is no simple answer to this question. However, according to the press conference given by Fed Chair, Jerome Powell, after the Federal Open Market Committee (FOMC) meeting in July, it seems that Fed officials are starting to believe that the ‘Non-Accelerating Inflation Rate of Unemployment’ (NAIRU) is higher today than it was prior to the COVID-19 pandemic outbreak in 2020 (see the Weekly Economics for August 5, 2022).
If this is the case, then it spells trouble for the US economy, the rate of unemployment, and thus for the misery index, as the Fed is probably going to increase interest rates until they bring the rate of unemployment high enough to contain inflation according to this NAIRU explanation of inflation.
Looking at the graph below, after the COVID-19 pandemic many Americans have been reluctant to return or reengage in the labor force and firms have had to increase wages to bring back workers.
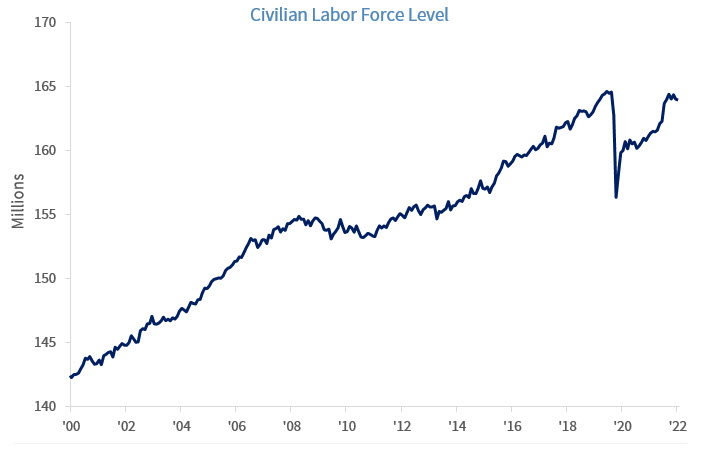
However, the effort seems to have stalled early this year as the labor force level has started to come back down again. Thus, the unemployment rate in January and February of 2020, just before the pandemic, was at 3.5%, just like today. However, the level of the labor force was at ~164.6 million while today’s labor force level is at ~164M or ~570,000 fewer people today than when we had a similar rate of unemployment.
Furthermore, more than one million Americans have died since the pandemic started and although many of them were older, and probably retired, many of them were younger and probably still engaged in the US labor force. Thus, this recovery from the pandemic has caught firms with a reduced supply of labor and that has contributed to the increase in wages, which tends to push prices higher in what economists call a process of ‘cost-pull inflation.’
But inflation is not only going up due to ‘cost-pull’ factors but also due to what is called ‘demand-push’ factors, as Americans have reengaged in the economy after an almost two-year hiatus and used their savings over that period to catch up in buying goods and services. That was also a large contributor to inflation since early 2021. However, this ‘demand-push’ inflation has been winding down as real disposable incomes have come down and demand is adjusting back to what it looked like pre-COVID recession, that is, more service oriented than goods oriented.
Thus, the Fed need not worry too much about ‘demand-push’ factors driving inflation and should concentrate on ‘cost-pull’ factors. This is the reason why it is so concerned about the potential existence of a higher NAIRU rate of unemployment and has focused its efforts on slowing down the economy to bring down these ‘cost-pull’ factors, which are basically driven by higher labor costs.
This means that we will be tracking what is happening with wage and salary pressures as this will determine the path for Fed interest rate increases during the next several months.
Economic Growth is Slowing Down in an Orderly Fashion
Economic data released during the last month continues to point to a further slowdown in economic activity. Perhaps the only exception to this trend has been exports, which contributed to economic growth, especially during the second quarter of the year despite the strength in the US dollar. The good news on the economy, if this could be depicted as goods news, is that this slowdown has been an orderly one, triggered by higher inflation, higher interest rates, lower real disposable personal income, and lower real personal consumption expenditures.
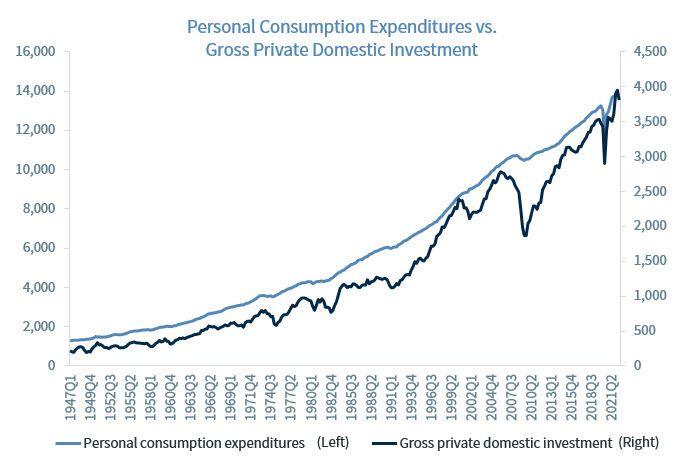
However, as it has always been the case, ‘orderly’ has a very different meaning for the most volatile sector in the economy, that is, for investment, or gross private domestic investment. Investment turned the corner during the second quarter of the year, bringing down GDP growth to negative territory during the quarter. Investment is, normally, not only the most volatile sector of GDP but also one of the most revised components of GDP. As an example, investment was originally reported up by only 0.1% during the first quarter of the year but was revised up to 5.0% during the third estimate of Q1 GDP. Thus, estimating investment is also a very difficult task. The graph below clearly shows the difference in behavior over history of two components of GDP, personal consumption expenditures (PCE) and gross private domestic investment (GPDI). It is clear that consumption (PCE) is the more stable of these two components of GDP.
Having said this, even if investment has the potential for being revised during the second estimate of Q2 GDP, the direction of that revision is also not known. That is, the revision could be upwards or downwards. If it is revised downwards then it will mean that, all other things constant, Q2 GDP would be revised further into negative territory.
In principle, everybody was expecting investment lower in the second quarter because investment is the most interest rate sensitive sector of GDP. And since higher interest rates have been affecting business decisions since early in the year, lower investment expenditures were already included in the Q2 GDP expectations. However, the only uncertainty today is whether the 13.5% decline in gross private domestic investment (GPDI) reported in Q2 was correct, higher, or lower. This will determine whether GDP for the second quarter remains as is, is revised up, or down, respectively.
Economic and market conditions are subject to change.
Opinions are those of Investment Strategy and not necessarily those Raymond James and are subject to change without notice the information has been obtained from sources considered to be reliable, but we do not guarantee that the foregoing material is accurate or complete. There is no assurance any of the trends mentioned will continue or forecasts will occur last performance may not be indicative of future results.
Consumer Price Index is a measure of inflation compiled by the US Bureau of Labor Studies. Currencies investing are generally considered speculative because of the significant potential for investment loss. Their markets are likely to be volatile and there may be sharp price fluctuations even during periods when prices overall are rising.
Consumer Sentiment is a consumer confidence index published monthly by the University of Michigan. The index is normalized to have a value of 100 in the first quarter of 1966. Each month at least 500 telephone interviews are conducted of a contiguous United States sample.
The producer price index is a price index that measures the average changes in prices received by domestic producers for their output. Its importance is being undermined by the steady decline in manufactured goods as a share of spending.
Industrial production: Industrial and production engineering is a measure of output of the industrial sector of the economy. The industrial sector includes manufacturing, mining, and utilities.
Personal Consumption Expenditures Price Index (PCE): The PCE is a measure of the prices that people living in the United States, or those buying on their behalf, pay for goods and services. The change in the PCE price index is known for capturing inflation (or deflation) across a wide range of consumer expenses and reflecting changes in consumer behavior.
FHFA house price index is a quarterly index that measures average changes in housing prices based on sales or refinancing’s of single-family homes whose mortgages have been purchased or securitized by Fannie Mae or Freddie Mac.
Consumer confidence index is an economic indicator published by various organizations in several countries. In simple terms, increased consumer confidence indicates economic growth in which consumers are spending money, indicating higher consumption.
ISM Manufacturing indexes are economic indicators derived from monthly surveys of private sector companies.
ISM Services Index is an economic index based on surveys of more than 400 non-manufacturing (or services) firms’ purchasing and supply executives.
Non-Manufacturing Business Activity Index is a seasonally adjusted index released by the Institute for Supply Management measuring business activity and conditions in the United States service economy as part of the Non-Manufacturing ISM Report on Business.
New orders index measures the value of the orders received in the course of the month by French companies with over 20 employees in the manufacturing industries working on orders.
Source: FactSet, data as of 6/3/2022
Markets & Investing Members of the Raymond James Investment Strategy Committee share their views on...
Markets & Investing Review the latest Weekly Headings by CIO Larry Adam. Key Takeaways ...
Technology & Innovation Learn about a few simple things you can do to protect your personal information...