Chief Economist Eugenio J. Alemán discusses current economic conditions.
Over the last several months we have answered several questions from clients regarding renewed speculation on the U.S. dollar as well as about other countries in the world potentially moving back to a ‘gold standard,’ as if the gold standard was a sort of panacea that would save us, that is, save the U.S. and/or the global economy, from its current problems.
We have heard stories that countries around the world have been accumulating gold since the 1970s in a process that ‘points to adopting the gold standard’ again. As we navigate the first days of 2023 it means that, if this process was actually true, it has been a very long process, one that has taken more than 50 years and we have nothing to show! If more than 50 years is not enough to go back to the gold standard, then how long does the world needs to get it done?
The truth is that it actually makes no sense for the world to move to a gold standard. The world left the gold standard in 1933 and then implemented something similar to a gold standard, or a quasi-gold standard, after WWII. The system was called the Bretton Woods agreement. This system lasted until the 1970s. So, is the argument that countries around the world have been trying to go back to something like the system we had until 1933, a pure gold standard or a Bretton Woods type of system, or quasi-gold standard? Again, it makes no sense to argue that countries around the world have been in the process of going back to a gold standard or anything like that kind of system.
The question is then, what if some countries do try to go back to the gold standard? Well, they do it at their own peril. If they do something like that on their own, they will be on their own and at the whims of nature. A gold standard is akin to a fixed exchange rate. There are several countries that have fixed exchange rates, but these countries are small, and they normally tie their currency to a major world currency that is based on a flexible exchange rate. The majority of the countries of the world have flexible exchange rates. We wrote about the U.S. dollar several months ago (Weekly Economics, 9/30/2022) and one of the benefits of having a flexible exchange rate is that flexible exchange rates work as a shock absorber for the economy.
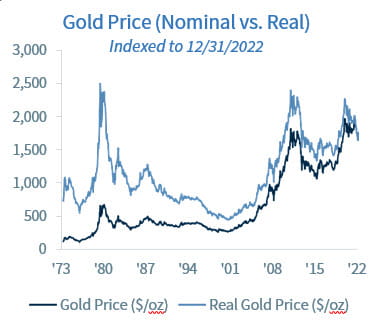
Others argue that going back to a gold standard would bring inflation down. Why? Who said so? Where are is the evidence (i.e., the data) that supports this argument? Have you looked at the historical numbers to conclude that? What prevents inflation from increasing in a gold standard scheme? Every time we see a video of people saying that countries are going to go back to the gold standard our suspicions about somebody wanting to sell gold at any costs increases. Not that gold may not be a good alternative for investors trying to diversify their portfolio, and clients should always contact their advisors to weigh their alternatives, but investing in gold is not a panacea either. Who says that gold prices cannot go down?
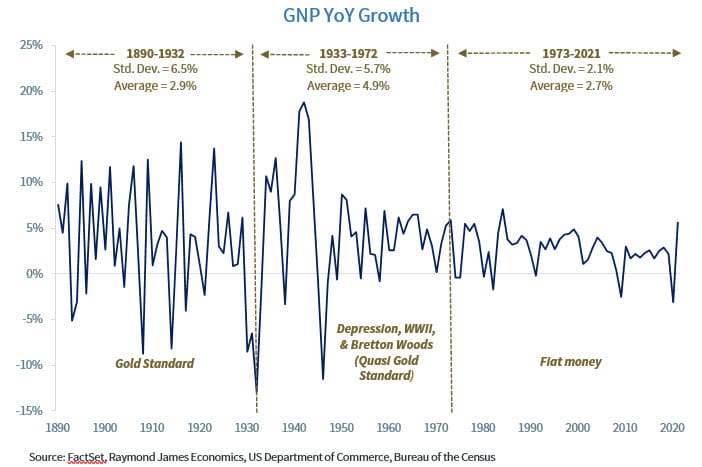
The graphs below include three periods of U.S. economic history. The graphs are for the year-over-year consumer price index (CPI), i.e., inflation, and for growth in gross national product (GNP) (we used GNP rather than GDP to keep our analysis consistent across time, but the conclusions are not affected by our choice of variable in this case), that is the rate of growth in the U.S. economy. The three periods are: the period when the gold standard was in effect, which goes from 1890 up to the New Deal in 1933; the second period includes parts of the Great Depression, WWII and the Bretton Woods agreement of a quasi-gold standard; the third period is after the abandonment of the Bretton Woods agreement in 1973 until today, that is, the period of fiat currency. Both graphs include the average inflation rate and/or percentage growth in GNP per year as well as the standard deviation of both the CPI inflation as well as the standard deviation of the growth rate of GDP. We use the standard deviation to measure the volatility of both, inflation as well as GNP.
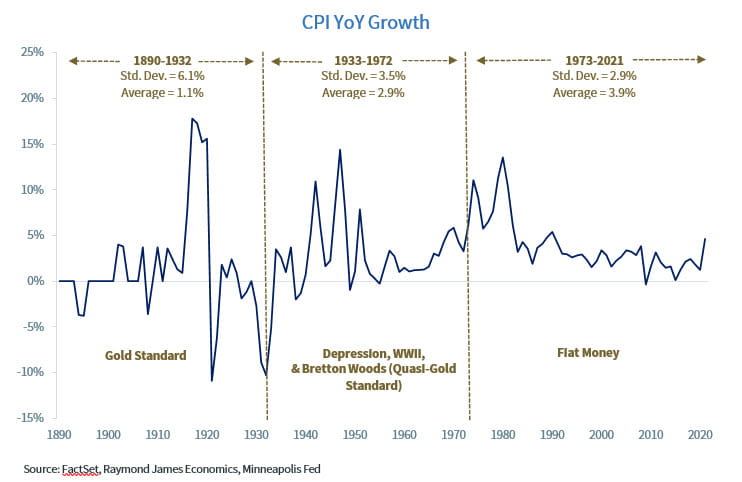
It is true that average inflation during the gold standard period was lower than the rate of inflation in the other two periods, but the standard deviation, that is, the volatility of the rate of inflation, was more than twice during the gold standard period than in the fiat currency period after the abandonment of the Bretton Woods agreement. Furthermore, we cannot even say that a 1.1% average inflation rate is better than a 3.9% average rate over time. In fact, the highest inflation years in the history of the U.S. occurred during the gold standard years, not during the fiat currency years, even though the beginning of the fiat currency period was affected by a never seen before surge in petroleum prices that the previous historical periods did not experience.
The same is true for GNP growth. But for GNP growth the story is even better as a case against a gold standard. Average GNP growth was 2.7% during the fiat currency period while it was 2.9% during the gold standard period. However, the standard deviation of GNP growth was only 2.1% during the fiat currency period but more than three times higher, 6.5%, during the gold standard period. Thus, the swings in the business cycle during the gold standard period were three times more volatile (i.e., damaging) than during the fiat currency period.
And we did not talk about how many financial crises or banking panics we experienced during the gold standard period (five banking panics) compared to the fiat currency period (two banking panics if we consider the savings and loan crisis of the 1980s as one of them) as the U.S. created the Federal Reserve Bank, the FDIC, the Comptroller of the Currency, and other institutions to stabilize financial markets.
The bottom line is that we don’t believe we are going back to a gold standard. And as history has shown, a gold standard is not a panacea that will solve all our problems, not even the problem many argue it will solve, that is, to bring down inflation.
Economic Data: One for the Bulls, One for the Bears
This morning’s economic data was surprising, to say the least, both for those who believe that things are good as well as those who think that things are bad.
The employment report surprised on the upside with nonfarm employment posting an increase in jobs of 223,000 during the last month of 2022 while the ISM Services PMI showed the first month of contraction for that Index since May 2020, a complete surprise, as FactSet consensus was expecting it to remain in expansion territory during December.
But even if the data had one for the bulls and one for the bears, it is clear that, overall, the U.S. economy is slowing down, which is what the Federal Reserve (Fed) has been trying to engineer since it started to increase interest rates early in 2022. That is, we believe the Fed is on pace to affect ‘animal spirits’ so as to weaken economic activity so much that inflation is going to continue to slow down.
Thus, we believe that no matter whether the terminal federal funds rate is 5.00% or 5.50% at the end of the current monetary cycle, the U.S. economy is in a clear slowdown trajectory, and this is good news for the Fed, for inflation and for the markets.
Economic and market conditions are subject to change.
Opinions are those of Investment Strategy and not necessarily those of Raymond James and are subject to change without notice. The information has been obtained from sources considered to be reliable, but we do not guarantee that the foregoing material is accurate or complete. There is no assurance any of the trends mentioned will continue or forecasts will occur. Last performance may not be indicative of future results.
Consumer Price Index is a measure of inflation compiled by the U.S. Bureau of Labor Statistics. Currencies investing is generally considered speculative because of the significant potential for investment loss. Their markets are likely to be volatile and there may be sharp price fluctuations even during periods when prices overall are rising.
Consumer Sentiment is a consumer confidence index published monthly by the University of Michigan. The index is normalized to have a value of 100 in the first quarter of 1966. Each month at least 500 telephone interviews are conducted of a contiguous United States sample.
Personal Consumption Expenditures Price Index (PCE): The PCE is a measure of the prices that people living in the United States, or those buying on their behalf, pay for goods and services. The change in the PCE price index is known for capturing inflation (or deflation) across a wide range of consumer expenses and reflecting changes in consumer behavior.
The Consumer Confidence Index (CCI) is a survey, administered by The Conference Board, that measures how optimistic or pessimistic consumers are regarding their expected financial situation. A value above 100 signals a boost in the consumers’ confidence towards the future economic situation, as a consequence of which they are less prone to save, and more inclined to consume. The opposite applies to values under 100.
Leading Economic Index: The Conference Board Leading Economic Index is an American economic leading indicator intended to forecast future economic activity. It is calculated by The Conference Board, a non- governmental organization, which determines the value of the index from the values of ten key variables
Certified Financial Planner Board of Standards Inc. owns the certification marks CFP®, Certified Financial Planner™, CFP® (with plaque design) and CFP® (with flame design) in the U.S., which it awards to individuals who successfully complete CFP Board’s initial and ongoing certification requirements.
Links are being provided for information purposes only. Raymond James is not affiliated with and does not endorse, authorize or sponsor any of the listed websites or their respective sponsors. Raymond James is not responsible for the content of any website or the collection or use of information regarding any website’s users and/or members.
GDP Price Index: A measure of inflation in the prices of goods and services produced in the United States. The gross domestic product price index includes the prices of U.S. goods and services exported to other countries. The prices that Americans pay for imports aren’t part of this index.
FHFA House Price Index: The FHFA House Price Index is the nation’s only collection of public, freely available house price indexes that measure changes in single-family home values based on data from all 50 states and over 400 American cities that extend back to the mid-1970s.
Expectations Index: The Expectations Index is a component of the Consumer Confidence Index® (CCI), which is published each month by the Conference Board. The CCI reflects consumers’ short-term—that is, six- month—outlook for, and sentiment about, the performance of the overall economy as it affects them.
Present Situation Index: The Present Situation Index is an indicator of consumer sentiment about current business and job market conditions. Combined with the Expectations Index, the Present Situation Index makes up the monthly Consumer Confidence Index.
Pending Home Sales Index: The Pending Home Sales Index (PHS), a leading indicator of housing activity, measures housing contract activity, and is based on signed real estate contracts for existing single-family homes, condos, and co-ops. Because a home goes under contract a month or two before it is sold, the Pending Home Sales Index generally leads Existing-Home Sales by a month or two.
DISCLOSURES
Import Price Index: The import price index measure price changes in goods or services purchased from abroad by
U.S. residents (imports) and sold to foreign buyers (exports). The indexes are updated once a month by the Bureau of Labor Statistics (BLS) International Price Program (IPP).
ISM New Orders Index: ISM New Order Index shows the number of new orders from customers of manufacturing firms reported by survey respondents compared to the previous month.ISM Employment Index: The ISM Manufacturing Employment Index is a component of the Manufacturing Purchasing Managers Index and reflects employment changes from industrial companies.
ISM Inventories Index: The ISM manufacturing index is a composite index that gives equal weighting to new orders, production, employment, supplier deliveries, and inventories.
ISM Production Index: The ISM manufacturing index or PMI measures the change in production levels across the
U.S. economy from month to month.
ISM Services PMI Index: The Institute of Supply Management (ISM) Non-Manufacturing Purchasing Managers’ Index (PMI) (also known as the ISM Services PMI) report on Business, a composite index is calculated as an indicator of the overall economic condition for the non-manufacturing sector.
Source: FactSet, data as of 12/29/2022
Markets & Investing Members of the Raymond James Investment Strategy Committee share their views on...
Markets & Investing Review the latest Weekly Headings by CIO Larry Adam. Key Takeaways ...
Technology & Innovation Learn about a few simple things you can do to protect your personal information...