Chief Economist Eugenio J. Alemán discusses current economic conditions.
The Federal Reserve (Fed) conducts monetary policy through its main instrument, the federal funds rate, which is the rate banks charge each other in the overnight market. Quantitative easing/tightening, e.g., the buying/selling of Treasurys as well as mortgage-backed securities from the markets, has also become important for Fed monetary policy, but the instrument that guides market interest rates is still the federal funds rate.
In a nutshell, the process works like this: if the Fed wants to decrease the federal funds rate, it buys U.S. Treasurys from the market, injecting liquidity into the market and lowers the federal funds rate. The opposite, which is selling U.S. Treasurys into the market, removes liquidity and increases the federal funds rate.
The federal funds rate is the only interest rate determined by the Fed. The rest of the market rates of interest respond to this federal funds rate.
When the federal funds rate goes down, it injects liquidity into the financial sector and the sector creates money through what is called the ‘money multiplier.’ Thus, money supply increases when the Fed lowers the federal funds rate while money supply declines when the Fed increases the federal funds rate.
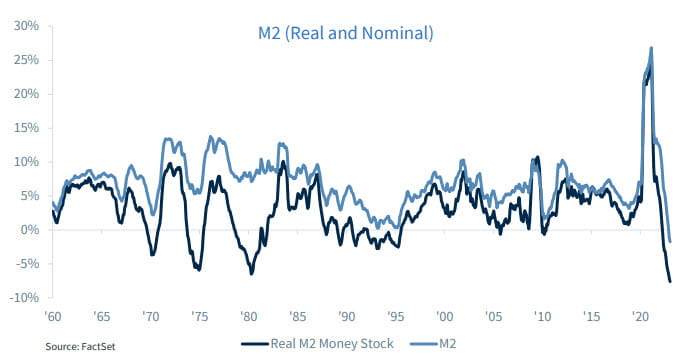
But the more important question is, was the COVID-19 pandemic a truly monetary cycle? The answer is no. It was not a monetary cycle; it was a fiscal cycle. That is, the increase in money supply depicted in the graph above wasn’t that the financial system went crazy and started lending money like there was no tomorrow and now, because interest rates are going up, it has to call back all the loans in order to dry the market of excess liquidity, as is the case in a monetary tightening cycle. What happened during the COVID-19 pandemic was a fiscal cycle. That is, the government transferred trillions of dollars to individuals and businesses through different programs, from direct payments ($1,200, $600, $1,400 checks) to unemployment insurance payments that included $600 extra per week for individuals who lost their jobs during the pandemic, plus PPP loans that ended up being direct payments because the majority of businesses did not have to pay the money back to the government. This is the reason why money supply skyrocketed during the pandemic, not because banks were lending money.
If we compare lending by the financial sector in the U.S. during the pre-Great Recession period and lending during the pre-COVID-19 pandemic period as well as during the COVID-19 pandemic period, we see that there are no similarities between the two periods. In the graphs below we have calculated nominal as well as real lending by the U.S. financial sector and we can see that most of the increase in total lending during the last year and a half has been due to the increase in inflation, as real lending has remained relatively contained.
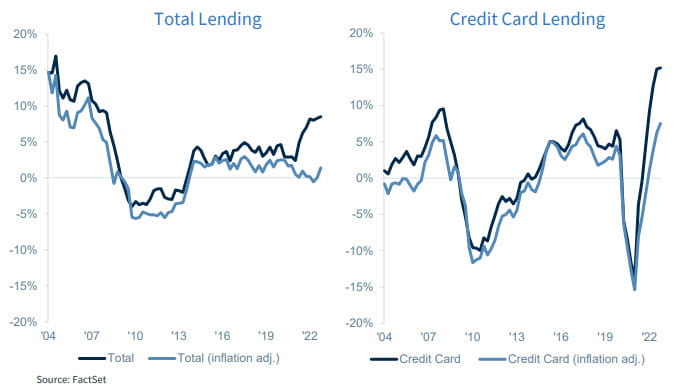
Having said this, the only exception has been credit card lending, which has increased considerably, both in nominal as well as real terms, after declining by almost 15% in the aftermaths of the COVID-19 recession. Still, real credit card lending is growing at about 8% on a year over year basis while nominal credit card lending is growing at about 15% on a year earlier basis, the difference being inflation.
This large growth in credit card lending is probably at the root of the Fed’s concerns today and the reason why it is talking about even higher interest rates. The fact that credit card lending, which is unsecured debt, and which commands the highest interest rates of all credit, continues to grow at such high rates is something that it is not going unnoticed by the Fed and has the potential to increase the risks for the US financial sector.
Changes to our forecast
We have made changes to our forecast, which depend, fundamentally, on how far the Fed goes in increasing interest rates. We are now expecting the Fed to get to a terminal rate of 5.50% by the middle of 2023, as it increases interest rates by 25 bps during the next three Federal Open Market Committee Meetings (FOMC).
Furthermore, the fact that the U.S. labor market as well as the service sector have remained so strong has made us push the start of the recession to the third quarter of the year and lasting two quarters. Thus, we expect the economy to suffer a mild recession during this year and to start recovering at the beginning of 2024. This forecast is predicated on the ability of the Fed to slow down inflation to a more comfortable level through a slowdown in, and it assumes that the Fed will not have to raise rates higher than our forecast. In order to achieve this, the Fed needs to increase interest rates further so credit card lending starts to come down.
Economic and market conditions are subject to change.
Opinions are those of Investment Strategy and not necessarily those of Raymond James and are subject to change without notice. The information has been obtained from sources considered to be reliable, but we do not guarantee that the foregoing material is accurate or complete. There is no assurance any of the trends mentioned will continue or forecasts will occur. Last performance may not be indicative of future results.
Consumer Price Index is a measure of inflation compiled by the U.S. Bureau of Labor Statistics. Currencies investing is generally considered speculative because of the significant potential for investment loss. Their markets are likely to be volatile and there may be sharp price fluctuations even during periods when prices overall are rising.
Consumer Sentiment is a consumer confidence index published monthly by the University of Michigan. The index is normalized to have a value of 100 in the first quarter of 1966. Each month at least 500 telephone interviews are conducted of a contiguous United States sample.
Personal Consumption Expenditures Price Index (PCE): The PCE is a measure of the prices that people living in the United States, or those buying on their behalf, pay for goods and services. The change in the PCE price index is known for capturing inflation (or deflation) across a wide range of consumer expenses and reflecting changes in consumer behavior.
The Consumer Confidence Index (CCI) is a survey, administered by The Conference Board, that measures how optimistic or pessimistic consumers are regarding their expected financial situation. A value above 100 signals a boost in the consumers’ confidence towards the future economic situation, as a consequence of which they are less prone to save, and more inclined to consume. The opposite applies to values under 100.
Leading Economic Index: The Conference Board Leading Economic Index is an American economic leading indicator intended to forecast future economic activity. It is calculated by The Conference Board, a non- governmental organization, which determines the value of the index from the values of ten key variables
Certified Financial Planner Board of Standards Inc. owns the certification marks CFP®, Certified Financial Planner™, CFP® (with plaque design) and CFP® (with flame design) in the U.S., which it awards to individuals who successfully complete CFP Board’s initial and ongoing certification requirements.
Links are being provided for information purposes only. Raymond James is not affiliated with and does not endorse, authorize or sponsor any of the listed websites or their respective sponsors. Raymond James is not responsible for the content of any website or the collection or use of information regarding any website’s users and/or members.
GDP Price Index: A measure of inflation in the prices of goods and services produced in the United States. The gross domestic product price index includes the prices of U.S. goods and services exported to other countries. The prices that Americans pay for imports aren’t part of this index.
FHFA House Price Index: The FHFA House Price Index is the nation’s only collection of public, freely available house price indexes that measure changes in single-family home values based on data from all 50 states and over 400 American cities that extend back to the mid-1970s.
Expectations Index: The Expectations Index is a component of the Consumer Confidence Index® (CCI), which is published each month by the Conference Board. The CCI reflects consumers’ short-term—that is, six- month—outlook for, and sentiment about, the performance of the overall economy as it affects them.
Present Situation Index: The Present Situation Index is an indicator of consumer sentiment about current business and job market conditions. Combined with the Expectations Index, the Present Situation Index makes up the monthly Consumer Confidence Index.
Pending Home Sales Index: The Pending Home Sales Index (PHS), a leading indicator of housing activity, measures housing contract activity, and is based on signed real estate contracts for existing single-family homes, condos, and co-ops. Because a home goes under contract a month or two before it is sold, the Pending Home Sales Index generally leads Existing-Home Sales by a month or two.
DISCLOSURES
Import Price Index: The import price index measure price changes in goods or services purchased from abroad by
U.S. residents (imports) and sold to foreign buyers (exports). The indexes are updated once a month by the Bureau of Labor Statistics (BLS) International Price Program (IPP).
ISM New Orders Index: ISM New Order Index shows the number of new orders from customers of manufacturing firms reported by survey respondents compared to the previous month.ISM Employment Index: The ISM Manufacturing Employment Index is a component of the Manufacturing Purchasing Managers Index and reflects employment changes from industrial companies.
ISM Inventories Index: The ISM manufacturing index is a composite index that gives equal weighting to new orders, production, employment, supplier deliveries, and inventories.
ISM Production Index: The ISM manufacturing index or PMI measures the change in production levels across the
U.S. economy from month to month.
ISM Services PMI Index: The Institute of Supply Management (ISM) Non-Manufacturing Purchasing Managers’ Index (PMI) (also known as the ISM Services PMI) report on Business, a composite index is calculated as an indicator of the overall economic condition for the non-manufacturing sector.
Source: FactSet, data as of 12/29/2022
Markets & Investing Members of the Raymond James Investment Strategy Committee share their views on...
Markets & Investing Review the latest Weekly Headings by CIO Larry Adam. Key Takeaways ...
Technology & Innovation Learn about a few simple things you can do to protect your personal information...