Chief Economist Eugenio J. Alemán discusses current economic conditions.
This week’s inflation numbers were mostly positive and benign for the U.S. economy as well as for the Federal Reserve (Fed) and confirms our view that, at least for now, the Fed is done increasing interest rates for this monetary tightening cycle. However, the data also confirmed our concern that while better and on a disinflationary path, the speed of this disinflationary process continues to be less than stellar. This means that any pivot in interest rates by the Fed is going to remain highly uncertain compared to what markets are expecting. Furthermore, as we have argued for some time, the market’s misreading of the Fed’s intentions regarding interest rates could result in the Fed having to continue to increase interest rates in the future.
Recall that the Fed determines only one interest rate in the markets, the federal funds rate, while the rest of the rates are determined by market forces. That is, if market forces believe the Fed is going to reduce the federal funds rate in the near future because market participants think the U.S. economy is heading toward a recession, then this may prevent the Fed to continue to bring down inflation going forward. That is, if interest rates, other than the federal funds rate, move lower because markets think a recession will be enough to make the Fed relax monetary policy, then the Fed’s monetary policy campaign is going to be put at risk.
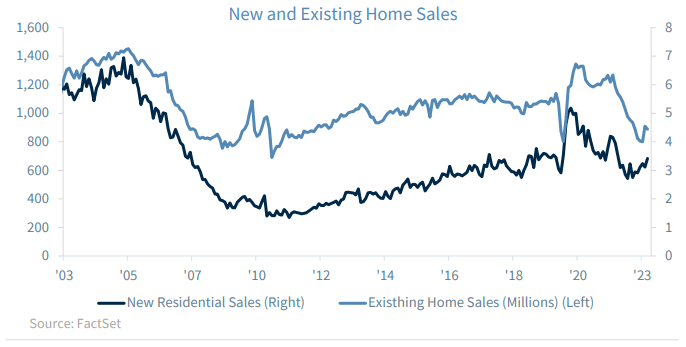
We saw some of this happening during the first quarter of the year when the yield on the 10-year Treasury declined and thus pushed mortgage interest rates lower, which improved the state of the U.S. housing market during the first quarter of the year as existing home sales, as well as new homes sales, increased during the period (see graph below). Fortunately for the Fed, home prices have continued to decline on a year-over-year basis during the first quarter of the year, but if interest rates on mortgages continue to decline or remain as low as they were during the first quarter of the year, quantity demanded of housing may increase enough to start pushing home prices higher again, which will threaten the efforts by the Fed to lower shelter costs and keep them contained until inflation stabilizes close to the 2% target over the longer term.
…But the road ahead is still long, according to our inflation heatmaps
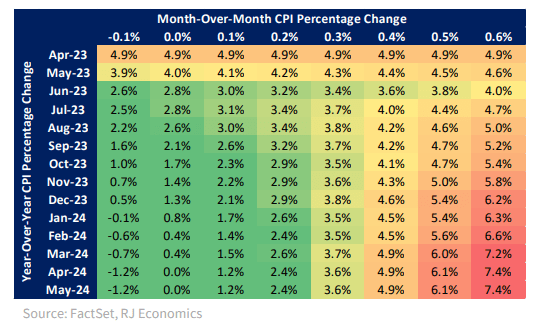
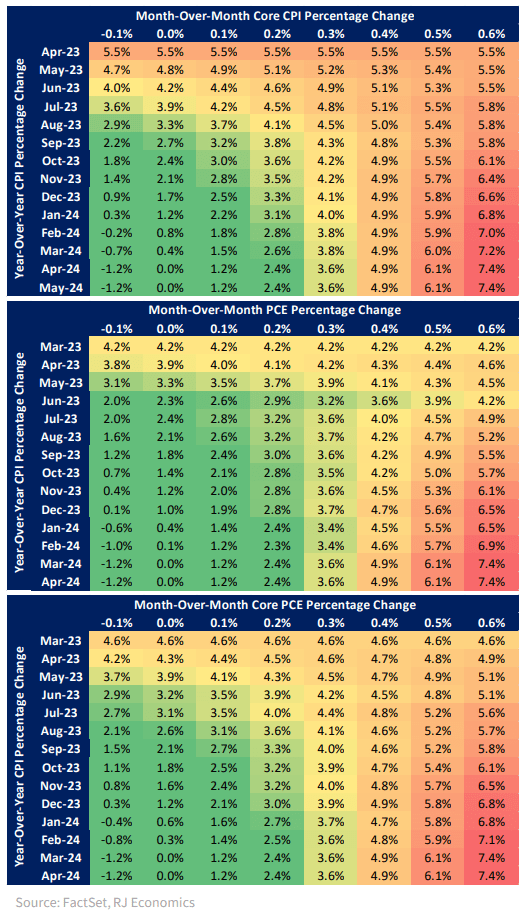
We have used these heatmaps in the past to show how different potential inflation scenarios could play out assuming that we have ‘constant’ monthly increases/decreases in prices over time. This is a very simple way of approaching the issue of inflation, but it helps get an idea of what could be the path forward. Of course, it is a very simple look at different potential paths of inflation if we assume constant monthly increases/decreases in prices, which is not what is going to happen. However, it is clear that, by looking at them, the path that will take us to a 2% rate of inflation is a path of inflation that goes from 0% to about 0.15% per month over the next year.
Needless to say, a path that includes a slight deflation—in our tables, this is the -0.1% column—is the fastest path to achieve the 2% inflation rate target for the Fed. However, a deflationary environment may require the Fed to provoke a deeper recession than what we have forecast for the US economy growing below potential during the next two years. However, it is conceivable that there are going to be some deflationary months going forward. This means that we can include some deflationary months in our range of monthly inflation rates, which means that the path to a 2% inflation target rate is probably going to include monthly inflation in the range of -0.1% to 0.2%. That is, anything above that range for monthly inflation is probably not going to take us to the promise land during the next year and we will have to wait longer to get there.
Below and on the next page, we include four heatmaps with both CPI, headline and core, as well as the PCE price index, headline and core for reference.
Economic and market conditions are subject to change.
Opinions are those of Investment Strategy and not necessarily those of Raymond James and are subject to change without notice. The information has been obtained from sources considered to be reliable, but we do not guarantee that the foregoing material is accurate or complete. There is no assurance any of the trends mentioned will continue or forecasts will occur. Last performance may not be indicative of future results.
Consumer Price Index is a measure of inflation compiled by the U.S. Bureau of Labor Statistics. Currencies investing is generally considered speculative because of the significant potential for investment loss. Their markets are likely to be volatile and there may be sharp price fluctuations even during periods when prices overall are rising.
Consumer Sentiment is a consumer confidence index published monthly by the University of Michigan. The index is normalized to have a value of 100 in the first quarter of 1966. Each month at least 500 telephone interviews are conducted of a contiguous United States sample.
Personal Consumption Expenditures Price Index (PCE): The PCE is a measure of the prices that people living in the United States, or those buying on their behalf, pay for goods and services. The change in the PCE price index is known for capturing inflation (or deflation) across a wide range of consumer expenses and reflecting changes in consumer behavior.
The Consumer Confidence Index (CCI) is a survey, administered by The Conference Board, that measures how optimistic or pessimistic consumers are regarding their expected financial situation. A value above 100 signals a boost in the consumers’ confidence towards the future economic situation, as a consequence of which they are less prone to save, and more inclined to consume. The opposite applies to values under 100.
Leading Economic Index: The Conference Board Leading Economic Index is an American economic leading indicator intended to forecast future economic activity. It is calculated by The Conference Board, a non- governmental organization, which determines the value of the index from the values of ten key variables
Certified Financial Planner Board of Standards Inc. owns the certification marks CFP®, Certified Financial Planner™, CFP® (with plaque design) and CFP® (with flame design) in the U.S., which it awards to individuals who successfully complete CFP Board’s initial and ongoing certification requirements.
Links are being provided for information purposes only. Raymond James is not affiliated with and does not endorse, authorize or sponsor any of the listed websites or their respective sponsors. Raymond James is not responsible for the content of any website or the collection or use of information regarding any website’s users and/or members.
GDP Price Index: A measure of inflation in the prices of goods and services produced in the United States. The gross domestic product price index includes the prices of U.S. goods and services exported to other countries. The prices that Americans pay for imports aren’t part of this index.
FHFA House Price Index: The FHFA House Price Index is the nation’s only collection of public, freely available house price indexes that measure changes in single-family home values based on data from all 50 states and over 400 American cities that extend back to the mid-1970s.
Expectations Index: The Expectations Index is a component of the Consumer Confidence Index® (CCI), which is published each month by the Conference Board. The CCI reflects consumers’ short-term—that is, six- month—outlook for, and sentiment about, the performance of the overall economy as it affects them.
Present Situation Index: The Present Situation Index is an indicator of consumer sentiment about current business and job market conditions. Combined with the Expectations Index, the Present Situation Index makes up the monthly Consumer Confidence Index.
Pending Home Sales Index: The Pending Home Sales Index (PHS), a leading indicator of housing activity, measures housing contract activity, and is based on signed real estate contracts for existing single-family homes, condos, and co-ops. Because a home goes under contract a month or two before it is sold, the Pending Home Sales Index generally leads Existing-Home Sales by a month or two.
DISCLOSURES
Import Price Index: The import price index measure price changes in goods or services purchased from abroad by
U.S. residents (imports) and sold to foreign buyers (exports). The indexes are updated once a month by the Bureau of Labor Statistics (BLS) International Price Program (IPP).
ISM New Orders Index: ISM New Order Index shows the number of new orders from customers of manufacturing firms reported by survey respondents compared to the previous month.ISM Employment Index: The ISM Manufacturing Employment Index is a component of the Manufacturing Purchasing Managers Index and reflects employment changes from industrial companies.
ISM Inventories Index: The ISM manufacturing index is a composite index that gives equal weighting to new orders, production, employment, supplier deliveries, and inventories.
ISM Production Index: The ISM manufacturing index or PMI measures the change in production levels across the
U.S. economy from month to month.
ISM Services PMI Index: The Institute of Supply Management (ISM) Non-Manufacturing Purchasing Managers’ Index (PMI) (also known as the ISM Services PMI) report on Business, a composite index is calculated as an indicator of the overall economic condition for the non-manufacturing sector.
Source: FactSet, data as of 12/29/2022
Markets & Investing Members of the Raymond James Investment Strategy Committee share their views on...
Markets & Investing Review the latest Weekly Headings by CIO Larry Adam. Key Takeaways ...
Technology & Innovation Learn about a few simple things you can do to protect your personal information...