Chief Economist Eugenio J. Alemán discusses current economic conditions.
The debt ceiling debate seems to be a never ending, ever recurring, event in American politics. This is, perhaps, one of the most inefficient mechanisms ever invented to settle disputes and it will remain a permanent threat to the wellbeing of Americans.
The fact that we have to deal with the debt ceiling again and again and that we cannot put it out of its misery doesn’t say much about the state of our political system. The U.S. Government, together with the U.S. Congress, every year, determines how much to collect in revenues and how much to spend. If, on any given year, this agreed upon spending is higher than what we are collecting in taxes, then we record a fiscal deficit. Thus, the deficit is a ‘flow’ variable, and it adds to the ‘stock’ variable, which is the U.S. debt.
In order to finance these deficits, the U.S. government goes to the financial market and issues Treasurys. Some of these Treasurys are bought by the Social Security Trust Fund as, by law, Social Security invests in the most reliable, trustworthy, and riskless securities in the world: U.S. Treasurys! Thus, putting at risk the truth worthiness of the U.S. government means that we are putting at risk our social security system as well as our livelihoods!
Having to authorize the U.S. government, every year, again and again, so it can service this debt makes absolutely no sense. And risking a potentially catastrophic crisis every time we get close to breaching this ceiling is even more senseless. Why? Because there is no reason why we have to get here. This should be a done deal each time the US government and the U.S. Congress settle their difference (however ugly this process may be) every year and agree to whatever revenues and spending should be.
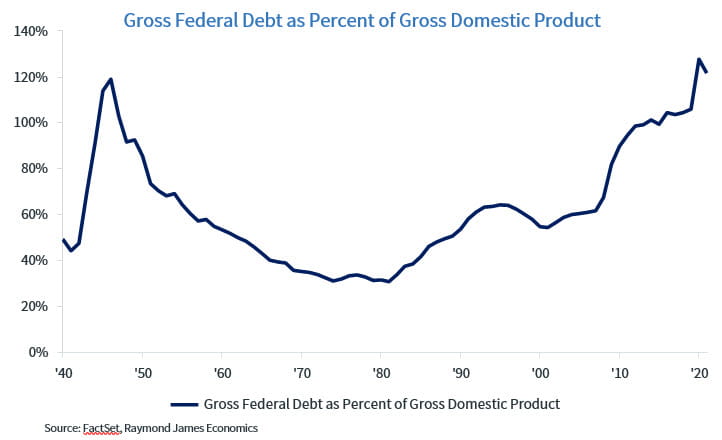
Furthermore, who says that governments actually pay down their debts? Governments are not like people or firms, and they need not be. Over time, by growing at a higher rate than that of our deficits, countries like the U.S. grow out of debt. This is what happened after World War II, when our debt hit about 120% of GDP. By the 1970s, our debt as a percentage of GDP was down to about 30%. But not because we paid back the debt, it was because we grew out of it over time.
The U.S. government just pays interest on the debt while at the same time rolling over that debt over time. For the last several decades, this rollover process has been very beneficial because interest rates have been very low, but now that interest rates are increasing, things are not looking so bright. Now, because interest rates are increasing, the rollover of the debt means that the U.S. government will have to pay more and more out of the budget to settle payments on the U.S. debt. This means that politicians will have to make very tough decisions, which may include cutting resources for some programs, raising taxes, and/or a combination of both.
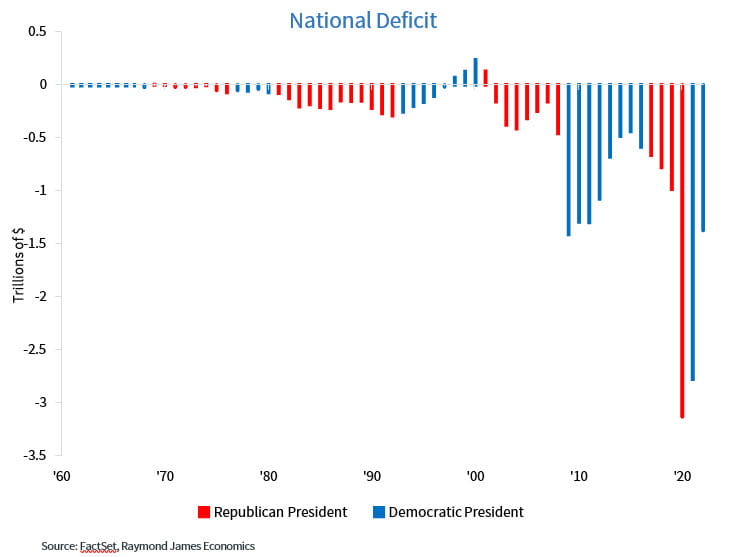
The graph above shows the U.S. government deficits since 1961. In the graph, we distinguish whether the deficit occurred during a Republican or a Democratic presidency. If we sum up the cumulative deficits since 1961, we find that during Democratic presidencies, the cumulative deficit has been $12 trillion while the cumulative deficits during Republican presidencies have been $10 trillion. Yes, the Democrats have accumulated more deficits than the Republicans, but the Republicans have been very close behind. However, if we deflate these deficits, that is, if we take the effects of inflation on these deficits, the cumulative deficits have been identical during both, Democratic and Republican presidencies. It doesn’t matter who is in power, deficits are normally large, irrespectively of who is in power.
Of course, this analysis is a very simple one, as it doesn’t consider particular episodes during our history that tend to increase spending relative to revenues, like COVID-19 or the Great Recession. During these periods, government spending increases at the same time that government revenues plunge because of the recessionary environments, making the deficits larger than they otherwise would have been and, in some sense, politicians are not completely responsible for such larger than expected deficits.
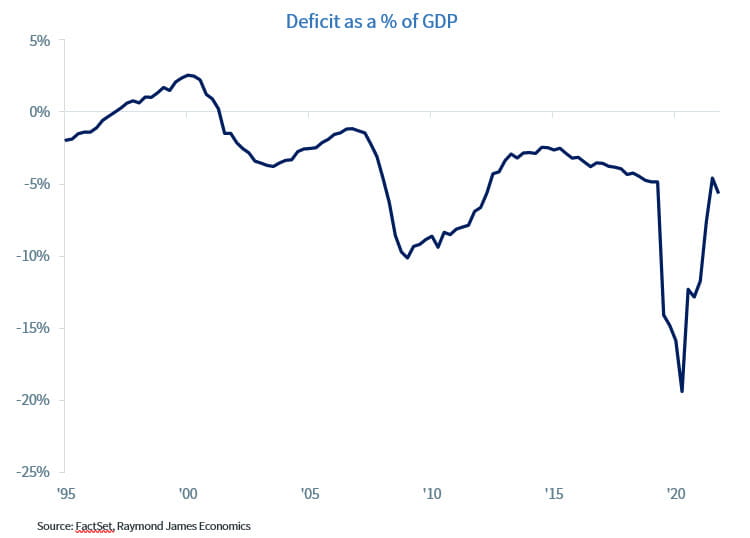
The U.S. has to fix the problem of ever larger deficits and, if you look at the graphs above and below, this is already occurring, slowly but surely. However, today’s debt level doesn’t give too much latitude in case we face more crises in the future so there is a need to make difficult decisions going forward. In the graph below, you can see that during the Great Recession, deficits as a percentage of GDP were growing fast. However, after the crisis ended, these deficits were coming down. Then the COVID pandemic hit and deficits started to grow very quickly again. However, they have come back down considerably, as the graph below shows.
The U.S. Congress will have to decide on how to fix the problem rather than threaten to blow up the system. However, every Representative and Senator has to respond to his/her constituents, and these constituents don’t want them to cut some of the programs that are already in place, like Social Security, Medicare, etc. Thus, agreements will have to be made and compromises will have to be agreed upon in order to continue to move in the direction of deficit reduction.
This means that political brinkmanship over this issue, which we showed is shared almost symmetrically by both political factions in this country, should not be something used to destabilize or threaten the health of the U.S. economy as well as the wellbeing of Americans.
Economic and market conditions are subject to change.
Opinions are those of Investment Strategy and not necessarily those of Raymond James and are subject to change without notice. The information has been obtained from sources considered to be reliable, but we do not guarantee that the foregoing material is accurate or complete. There is no assurance any of the trends mentioned will continue or forecasts will occur. Last performance may not be indicative of future results.
Consumer Price Index is a measure of inflation compiled by the U.S. Bureau of Labor Statistics. Currencies investing is generally considered speculative because of the significant potential for investment loss. Their markets are likely to be volatile and there may be sharp price fluctuations even during periods when prices overall are rising.
Consumer Sentiment is a consumer confidence index published monthly by the University of Michigan. The index is normalized to have a value of 100 in the first quarter of 1966. Each month at least 500 telephone interviews are conducted of a contiguous United States sample.
Personal Consumption Expenditures Price Index (PCE): The PCE is a measure of the prices that people living in the United States, or those buying on their behalf, pay for goods and services. The change in the PCE price index is known for capturing inflation (or deflation) across a wide range of consumer expenses and reflecting changes in consumer behavior.
The Consumer Confidence Index (CCI) is a survey, administered by The Conference Board, that measures how optimistic or pessimistic consumers are regarding their expected financial situation. A value above 100 signals a boost in the consumers’ confidence towards the future economic situation, as a consequence of which they are less prone to save, and more inclined to consume. The opposite applies to values under 100.
Leading Economic Index: The Conference Board Leading Economic Index is an American economic leading indicator intended to forecast future economic activity. It is calculated by The Conference Board, a non- governmental organization, which determines the value of the index from the values of ten key variables
Certified Financial Planner Board of Standards Inc. owns the certification marks CFP®, Certified Financial Planner™, CFP® (with plaque design) and CFP® (with flame design) in the U.S., which it awards to individuals who successfully complete CFP Board’s initial and ongoing certification requirements.
Links are being provided for information purposes only. Raymond James is not affiliated with and does not endorse, authorize or sponsor any of the listed websites or their respective sponsors. Raymond James is not responsible for the content of any website or the collection or use of information regarding any website’s users and/or members.
GDP Price Index: A measure of inflation in the prices of goods and services produced in the United States. The gross domestic product price index includes the prices of U.S. goods and services exported to other countries. The prices that Americans pay for imports aren’t part of this index.
FHFA House Price Index: The FHFA House Price Index is the nation’s only collection of public, freely available house price indexes that measure changes in single-family home values based on data from all 50 states and over 400 American cities that extend back to the mid-1970s.
Expectations Index: The Expectations Index is a component of the Consumer Confidence Index® (CCI), which is published each month by the Conference Board. The CCI reflects consumers’ short-term—that is, six- month—outlook for, and sentiment about, the performance of the overall economy as it affects them.
Present Situation Index: The Present Situation Index is an indicator of consumer sentiment about current business and job market conditions. Combined with the Expectations Index, the Present Situation Index makes up the monthly Consumer Confidence Index.
Pending Home Sales Index: The Pending Home Sales Index (PHS), a leading indicator of housing activity, measures housing contract activity, and is based on signed real estate contracts for existing single-family homes, condos, and co-ops. Because a home goes under contract a month or two before it is sold, the Pending Home Sales Index generally leads Existing-Home Sales by a month or two.
DISCLOSURES
Import Price Index: The import price index measure price changes in goods or services purchased from abroad by
U.S. residents (imports) and sold to foreign buyers (exports). The indexes are updated once a month by the Bureau of Labor Statistics (BLS) International Price Program (IPP).
ISM New Orders Index: ISM New Order Index shows the number of new orders from customers of manufacturing firms reported by survey respondents compared to the previous month.ISM Employment Index: The ISM Manufacturing Employment Index is a component of the Manufacturing Purchasing Managers Index and reflects employment changes from industrial companies.
ISM Inventories Index: The ISM manufacturing index is a composite index that gives equal weighting to new orders, production, employment, supplier deliveries, and inventories.
ISM Production Index: The ISM manufacturing index or PMI measures the change in production levels across the
U.S. economy from month to month.
ISM Services PMI Index: The Institute of Supply Management (ISM) Non-Manufacturing Purchasing Managers’ Index (PMI) (also known as the ISM Services PMI) report on Business, a composite index is calculated as an indicator of the overall economic condition for the non-manufacturing sector.
Source: FactSet, data as of 12/29/2022
Markets & Investing Members of the Raymond James Investment Strategy Committee share their views on...
Markets & Investing Review the latest Weekly Headings by CIO Larry Adam. Key Takeaways ...
Technology & Innovation Learn about a few simple things you can do to protect your personal information...