Chief Economist Eugenio J. Alemán discusses current economic conditions.
The Federal Reserve Bank of New York released it Household Debt and Credit quarterly report last week and showed an increase in household debt levels. According to the report, household debt balances increased $351 billion during the third quarter of the year to $16.51 trillion or an increase of 2.2% compared to the second quarter of 2022. This means that debt balances have increased $2.36 trillion since the end of 2019, just before the Covid-19 recession.
Out of the $351 billion increase in consumer credit during the quarter, $282 billion were allocated to mortgages. Total mortgage debt increased to $11.67 trillion at the end of September of this year and up $1 trillion since last year. Home equity lines of credit (HELOC) increased by $3 billion to $322 billion while credit card balances increased $38 billion compared to the second quarter. On a year-earlier basis, credit card balances were up 15%, which the report indicated was the largest increase in more than 20 years.
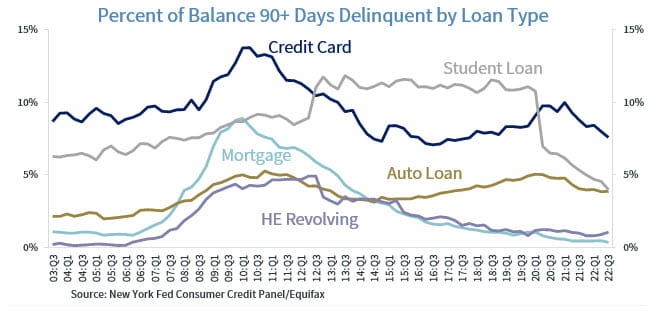
Mortgages debt remained the largest component of household debt at 70.7% of total household debt. The second largest was student loan debt, at 9.5% of total household debt, but whose percentage of total debt continued to fall. Meanwhile, auto loan debt represented 9.2% of total household debt in the third quarter of the year while credit card debt represented 5.6% of total household debt. The last component of debt, which is called other, represented 3.0% of total household debt during the third quarter of the year.
The increase in credit card debt received most of the headlines when the report was released because it was a very large increase in credit card debt in a quarter, up $38 billion. However, this increase was lower than the $46 billion increase during the second quarter of the year.
Although the increase in credit card balances is worrisome, delinquency rates were down across the board with the exception of HELOC delinquency rates, which increased slightly during the quarter. Thus, the increase in credit card debt doesn’t seem to be a problem at this time and may be consistent with the state of the U.S. labor market, as households remain positive regarding the ability to find and/or keep their jobs today. Of course, this will change if the U.S. labor market turns negative but for now the expectation from households seem to support higher borrowing.
Employment, Productivity, and the Recovery from the Pandemic
The recovery from the Covid-19 recession has been very different for different sectors of the economy as the recovery in employment has not been homogeneous across these sectors while, at the same time, productivity has been relatively low over that time period.
We could point out to sectors that have outperformed and sectors that have underperformed during the recovery. First, we look at which sectors have recovered in terms of employment and what sectors have not. Second, we calculated a simple measure of labor productivity by sector, dividing real value added for each sector of the economy by the number of workers in that sector over time and since the period immediately before the Covid-19 recession.
The first measure shows that employment by sector has, for the most part, surpassed the levels of employment found just before the Covid-19 recession. Table 1, which is also a heat-map, shows all the sectors of the economy by levels of employment since before the Covid-19 recession and until the second quarter of this year. It is an index so any sector that has an index of 100 or more shows that the sector’s employment levels are either at the pre-pandemic levels or higher, respectively. Conversely, if the number is below 100, it means that the sector has not recovered yet.
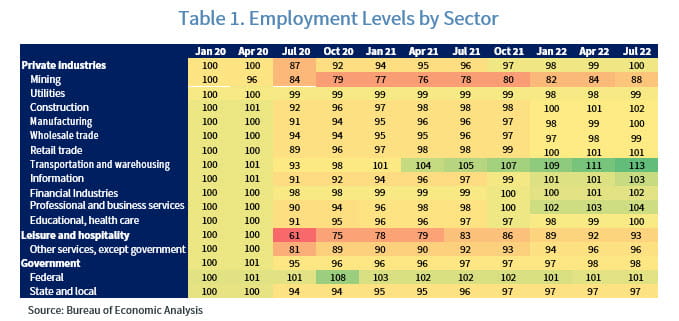
It is clear that some sectors have stacked up on workers and thus are more prone to laying off workers faster if the economy continues to slowdown. This may be the case of the transportation and warehousing sector, whose level of employment is, today, 13% higher than the level that existed just before the pandemic. Meanwhile, the mining sector’s employment levels are 12% lower than those reached before the pandemic recession and thus it is possible that this sector will continue to add to its workforce.
Our next measure is a proxy for productivity in each one of these sectors. As we said before, it is estimated by taking the “real value added” for each sector of the economy divided by the number of workers in each sector. The table below shows another heat map index that measures our calculated productivity measure.
In this case, Table 2 shows how “productive” each one of these sectors is today compared to the period just before the Covid-19 pandemic. According to this measure, the most productive sectors today are the Information, Professional and Business Services, and the Leisure and Hospitality sectors. We have chosen a value of more than 105 for the index to call these sectors the most productive ones. On the other hand, the least productive sectors are Mining, Construction, Retail Sales, and Transportation and Warehousing. For the less productive sectors, we have chosen a value of less than 95. Both values, higher than 105 for the most productive as well as lower than 95 for the least productive have been chosen arbitrarily. This means that the sectors higher than 95 and less than 105 are in a range that shows a “normal” level of productivity.
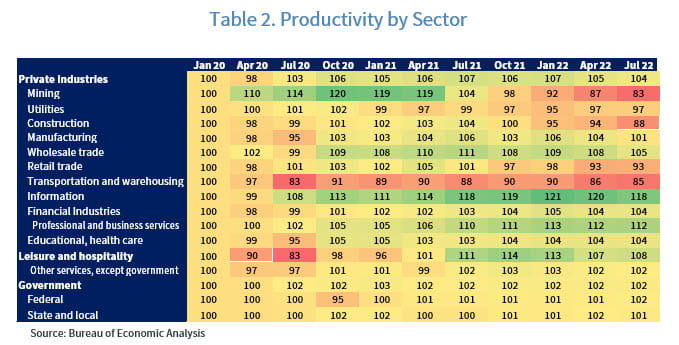
As we said before, while the transportation and warehousing sector’s employment levels are 13% higher today than before the pandemic recession, productivity in that sector is one of the lowest of all the sectors of the economy, at 85, or 15% less than before the pandemic recession. This could be pointing to a sector that could see large layoffs as the U.S. economy continues to weaken. Meanwhile, the information sector’s employment level is 3% higher than before the pandemic but its productivity is very high today, at 118, or 18% higher than before the pandemic recession. This could indicate that the sector is correctly staffed and that layoffs may not be so large if the U.S. economy weakens. The leisure and hospitality sector’s employment level today 7% lower than before the pandemic while its productivity is about 8% higher than before the pandemic recession, which could mean that this sector’s employment may continue to increase even if the economy slows down.
The mining sector seems to be a special case. As we mentioned before, the mining sector has very low levels of employment today compared the levels it had before the pandemic recession. However, at the same time, productivity is also very low today, but it was very high during 2020 and early 2021. Meanwhile, while the construction sector has more than recovered the levels of employment it had before the pandemic recession, its levels of productivity are very low today, which may indicate that the sector is primed for a relatively large correction if the housing market continues to deteriorate.
Economic and market conditions are subject to change.
Opinions are those of Investment Strategy and not necessarily those Raymond James and are subject to change without notice the information has been obtained from sources considered to be reliable, but we do not guarantee that the foregoing material is accurate or complete. There is no assurance any of the trends mentioned will continue or forecasts will occur last performance may not be indicative of future results.
Consumer Price Index is a measure of inflation compiled by the U.S. Bureau of Labor Studies. Currencies investing are generally considered speculative because of the significant potential for investment loss. Their markets are likely to be volatile and there may be sharp price fluctuations even during periods when prices overall are rising.
Consumer Sentiment is a consumer confidence index published monthly by the University of Michigan. The index is normalized to have a value of 100 in the first quarter of 1966. Each month at least 500 telephone interviews are conducted of a contiguous United States sample.
Personal Consumption Expenditures Price Index (PCE): The PCE is a measure of the prices that people living in the United States, or those buying on their behalf, pay for goods and services. The change in the PCE price index is known for capturing inflation (or deflation) across a wide range of consumer expenses and reflecting changes in consumer behavior.
Consumer confidence index is an economic indicator published by various organizations in several countries. In simple terms, increased consumer confidence indicates economic growth in which consumers are spending money, indicating higher consumption.
The Consumer Confidence Index (CCI) is a survey, administered by The Conference Board, that measures how optimistic or pessimistic consumers are regarding their expected financial situation.
Leading Economic Indicators: The Conference Board Leading Economic Index is an American economic leading indicator intended to forecast future economic activity. It is calculated by The Conference Board, a non-governmental organization, which determines the value of the index from the values of ten key variables
Certified Financial Planner Board of Standards Inc. owns the certification marks CFP®, CERTIFIED FINANCIAL PLANNER™, CFP® (with plaque design) and CFP® (with flame design) in the U.S., which it awards to individuals who successfully complete CFP Board’s initial and ongoing certification requirements.
Currencies investing are generally considered speculative because of the significant potential for investment loss. Their markets are likely to be volatile and there may be sharp price fluctuations even during periods when prices overall are rising.
The STOXX Europe 600, also called STOXX 600, SXXP, is a stock index of European stocks designed by STOXX Ltd. This index has a fixed number of 600 components representing large, mid and small capitalization companies among 17 European countries, covering approximately 90% of the free-float market capitalization of the European stock market (not limited to the Eurozone).
Geographical Revenues: Overall country-specific revenues as a percentage of total revenues from a specific index such as the S&P 500 or the STOXX Europe 600.
Source: FactSet, data as of 9/30/2022
Markets & Investing Members of the Raymond James Investment Strategy Committee share their views on...
Markets & Investing Review the latest Weekly Headings by CIO Larry Adam. Key Takeaways ...
Technology & Innovation Learn about a few simple things you can do to protect your personal information...