Read the weekly economic commentary from Chief Economist Scott Brown.
The April Employment Report was not as strong as it seems, but still consistent with moderate growth in the overall economy, tighter job market conditions, and moderate wage growth. Wage growth is likely being offset by faster productivity growth (although results will vary by firm and industry), restraining inflation pressures from the labor market. Ex-food & energy, the year-overyear increase in the PCE Price Index fell to 1.6% in March, below the Fed’s 2% goal. However, Fed Chair Powell downplayed low inflation readings as being due to transitory factors, dampening those looking for a Fed rate cut.
The first thing one notices in looking at a graph of the monthly changes in nonfarm payrolls is that these figures are volatile. Payroll growth varies widely around an underlying trend. The data are subject to significant statistical noise and seasonal adjustment is often quirky. Weather can also be a factor. Sometimes unseasonably mild weather pulls forward seasonal gains. Sometimes poor weather pushes out seasonal job gains. The economy typically adds more than four million jobs between January and June. Unadjusted, we’ve added 2.126 million jobs since January, vs. 2.378 million over the three months last year. That’s consistent with an underlying pace of job growth that is somewhat slower than last year, but still relatively strong.
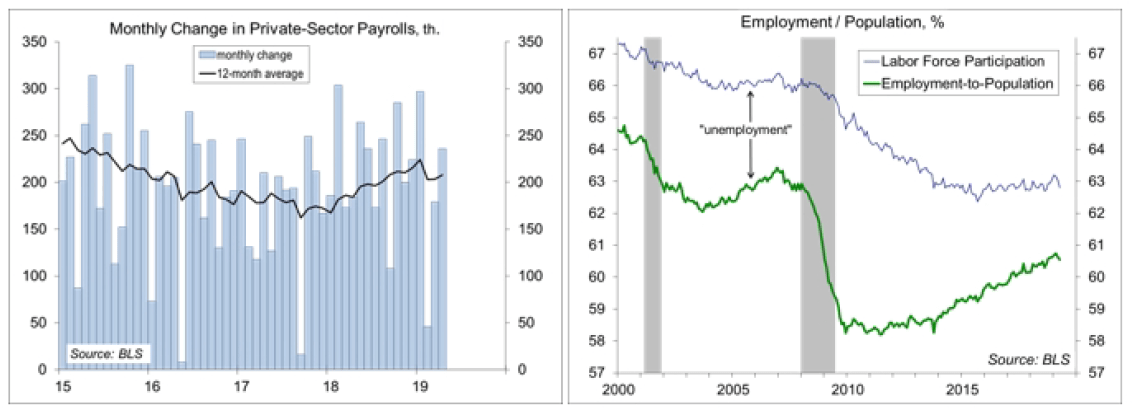
The unemployment rate fell to 3.6% in April, the lowest since December 1969 (3.5%). However, April’s decline was due to a decrease in labor force participation, particularly for the aged 25-54 cohort (which dropped from 82.5% to 82.2%). That looks like a problem with the seasonal adjustment. While the April figure was likely an aberration, the unemployment rate has been trending low. However, the low trend appears to be misrepresenting the amount of slack in the job market. While labor force participation dipped in April, the trend has been relatively flat. That’s actually a sign of strength, as the aging of the population implies that the participation rate should be trending lower. The employment-population ratio is below the pre-recession level, but not for those in the prime age cohorts (25-54). There appears to be room for teenagers and young adult to enter the job market, and a lot of those on the sidelines (without work, but not officially counted as unemployment) ought to be lured by better wages.
The tight labor market should lead to faster wage growth, and labor compensation has picked up, but it’s still relatively moderate by historical standards. The Employment Cost Index, which includes benefits, is a better measure than average hourly earnings. The ECI for private-sector workers rose 2.8% y/y in March. One still needs to adjust for productivity growth to gauge the inflationary impact. Nonfarm business productivity rose at a 3.7% annual rate in the first quarter. However, these figures are erratic (choppy and subject to large revisions). Productivity rose 2.4% year-over-year, leaving unit labor costs at 0.1% — essentially flat. Conditions will vary by firm, but the data suggest generally little inflation pressure coming from the labor market.
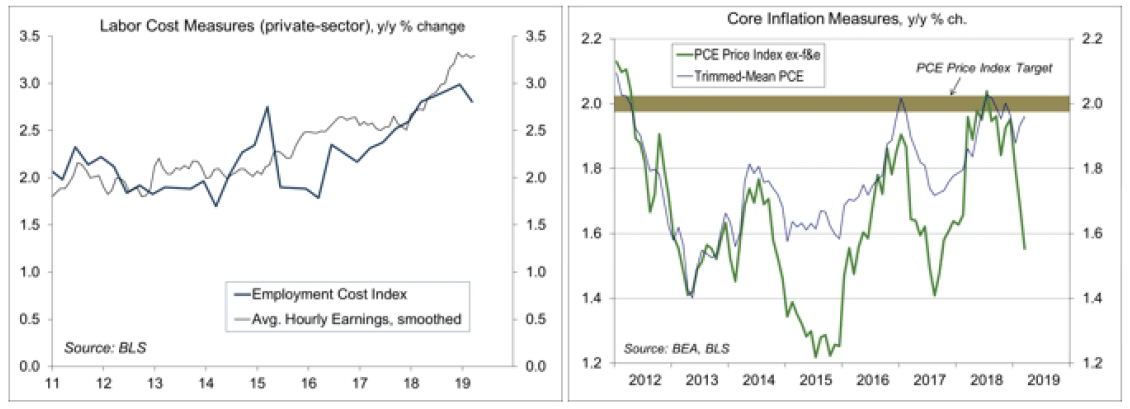
Meanwhile, the core PCE Price Index rose just 1.6% over the 12 months ending in March. The late Easter appears to have distorted apparel prices, which are likely to snap back in April. In his post-FOMC press conference, Fed Chair Powell downplayed the sub-2% inflation trend as being due to “transitory factors.” Powell also noted that the Dallas Fed’s trimmed-mean PCE Price Index, which excludes the items that registered the biggest increases or decreases in price in a given month, has remained close to Fed’s 2% goal.
The bottom line is that through all the noise and seasonal adjustment issues, the April Employment Report was consistent with Fed keeping shortterm interest rates unchanged for the foreseeable future. As Powell continued to note, future data will depend on the economic data. The data are expected to be mixed, but moderate over the near term.
Data Recap – The Fed left the federal funds target range unchanged, but Chair Powell quashed hopes for a rate cut by the end of the year. The employment report was not as strong as it looks and the monthly ISM surveys disappointed. Other data remained consistent with moderate growth in the near term.
As expected, the Federal Open Market Committee left the federal funds target range unchanged, at 2.25-2.50%. The FOMC did lower the Interest on Excess Reserves rate (IOER) by 5 basis points, to 2.35% in an effort to push the effective rate toward the middle of the range (this was a technical adjustment, not a change in the stance of monetary policy. The policy statement acknowledged that “growth of household spending and business fixed investment slowed in the first quarter” and “overall inflation and inflation for items other than food and energy have declined and are running below 2%.” Asked about the possibility of a rate cut later this year, Chair Powell indicated that “we don’t see a strong case for moving in either direction.”
The April Employment Report appeared strong, but was likely distorted by the seasonal adjustment and the late Easter. Nonfarm payrolls rose by 263,000 (+1.126 million before seasonal adjustment), led by gains in professional & business services, education & healthcare, and government. Construction payrolls rose moderately, manufacturing posted a modest gain, and we continued to lose jobs in retail (normally a sign of weaker sales, but the shift toward internet sales has likely been a factor). Monthly payroll figures tend to be choppy. Private-sector payrolls averaged a 154,000 gain over the last three months, although that figure was partly depressed by bad weather in February. Average Hourly Earnings rose 0.2% (+3.2% y/y), up 0.3% for production workers (+3.4% y/y). The unemployment rate fell to 3.6% (from 3.8%), although that was due to a drop in labor force participation (probably a seasonal adjustment issue in the household survey – the participation rate for those 25-54 fell from 82.5% to 82.2%).
The ADP Estimate of private-sector payrolls rose by 275,000 in the initial estimate for April, leaving the three-month average at +215,000 (we need less than 100,000 per month to absorb new entrants into the workforce).
Personal Income rose 0.1% in March (+3.8% y/y), held down by a 40.7% drop in farm income (reduced subsidies). Wage and salary income rose 0.4% (+4.2% y/y). Personal Spending jumped 0.9%, following a 0.1% increase in February (+4.4% y/y), reflecting gains in motor vehicles and gasoline (higher prices). The PCE Price Index rose 0.2% (+1.5% y/y), unchanged ex-food & energy (+0.046% before rounding, +1.6% y/y). Apparel prices fell 2.1% (-2.2% y/y), likely reflecting issues with the seasonal adjustment.
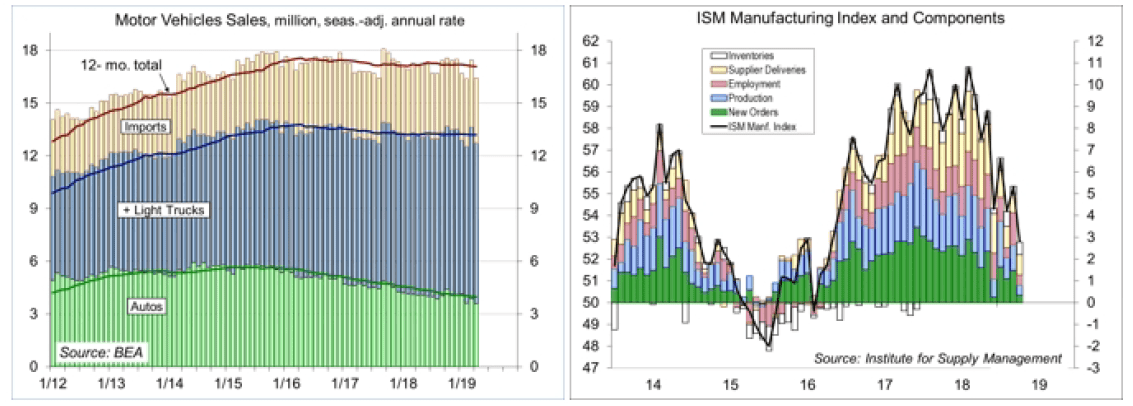
Unit Auto Sales fell to a 16.4 million seasonally adjusted annual rate in April, vs. 17.4 million in March and 16.5 million in February.
The ISM Manufacturing Index fell to 52.8 in April, vs. 55.3 in March, reflecting slower growth in new orders, production, and employment (each still positive). Input price pressures were flat. Comments from supply managers suggested that activity was generally steady (at a strong level), but tariffs and Mexico border issues added to supply chain concerns.
The Chicago Business Barometer fell to 52.6 in April, vs. 58.7 in March and 64.7 in February.
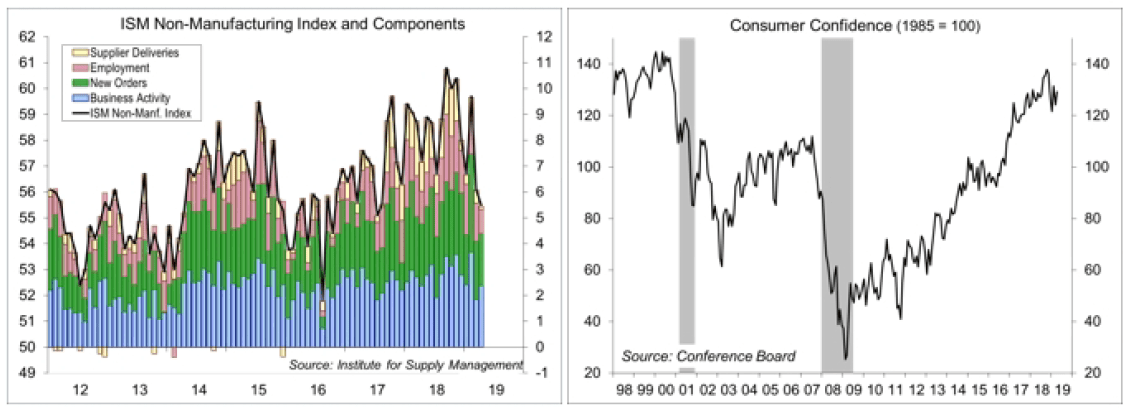
The ISM Non-Manufacturing Index edged down to 55.5 in April, vs. 56.1 in March and 59.7 in February. Growth in business activity picked up. Growth in new orders slowed, but remained at a moderately strong pace. Employment growth slowed. Input price pressures moderated. Comments from supply managers were mixed, but generally consistent with a leveling off in growth, focusing on supply issues (including labor).

The Conference Board’s Consumer Confidence Index rose to 129.2 in the initial estimate for April, vs. 124.1 in March and 131.4 in February. Job market perceptions remained strong.
The Employment Cost Index rose 0.7% over the three months ending in March (+2.8% y/y, vs. +2.7% y/y in March 2018).
Nonfarm Productivity rose at a 3.7% annual rate in 1Q19 (+2.4% y/y). Output rose at a 4.1% pace (+3.9% y/y), while hours rose 0.4% (+1.4% y/y). Unit labor costs, the key measure of inflation pressure from the labor market, fell at a 0.8% annual rate (+0.1% y/y). These figures can be quirky (choppy and subject to large revisions), but at face value they suggest little concern that inflation will ramp sharply higher anytime soon.
Jobless Claims held steady at 230,000 in the week ending April 27. The late Easter appears to have led to some distortions, although the underlying trend remains low.
Corporate layoff announcements totaled 40,023 in the Challenger Layoff Report for April, vs. 60,587 in March (figures are not seasonally adjusted) and 36,081 in April 2018. The report noted that “high job cut numbers in the manufacturing and automotive sectors are troubling, as changes in these industries tend to have a trickle-down effect.” The total for the first four months of 2019 was up 31% from the same period in 2018. Bear in mind, these are not actual layoffs, but the recent trend is consistent with other signs of softness in the manufacturing sector.
Factory Orders rose 1.9% in March (+2.0% y/y), reflecting a 31.0% spike in civilian aircraft orders. Durable goods orders rose 2.6% (+2.1% y/y). Orders for nondurable goods rose 1.1% (+1.8% y/y), reflecting higher petroleum prices. Ex-transportation, unfilled orders edged lower for the second consecutive month, consistent with a soft patch in the manufacturing sector. The Pending Home Sales Index rose 3.8% in March, down 1.2% from a year ago.
The opinions offered by Dr. Brown should be considered a part of your overall decision-making process. For more information about this report – to discuss how this outlook may affect your personal situation and/or to learn how this insight may be incorporated into your investment strategy – please contact your financial advisor or use the convenient Office Locator to find our office(s) nearest you today.
All expressions of opinion reflect the judgment of the Research Department of Raymond James & Associates (RJA) at this date and are subject to change. Information has been obtained from sources considered reliable, but we do not guarantee that the foregoing report is accurate or complete. Other departments of RJA may have information which is not available to the Research Department about companies mentioned in this report. RJA or its affiliates may execute transactions in the securities mentioned in this report which may not be consistent with the report’s conclusions. RJA may perform investment banking or other services for, or solicit investment banking business from, any company mentioned in this report. For institutional clients of the European Economic Area (EEA): This document (and any attachments or exhibits hereto) is intended only for EEA Institutional Clients or others to whom it may lawfully be submitted. There is no assurance that any of the trends mentioned will continue in the future. Past performance is not indicative of future results.