Chief Economist Eugenio J. Alemán discusses current economic conditions.
In the middle of 2023 we argued that, according to our forecast for GDP at the time for the whole of 2023, employment was growing too fast and that it would have to slow considerably during the second half of the year. Our forecast was lower than what actual growth was for the whole year but nevertheless, employment slowed down considerably during the second half of the year, albeit not as much as we were expecting. Furthermore, yesterday’s release of GDP growth for the last quarter of the year, up 3.3% on a quarter-over-quarter basis, annualized, confirmed that the U.S. economy remained strong as the year came to an end and that the economy grew at a 2.5% rate for the whole of 2023 compared to 2022.
However, we are still holding to our forecast for a slowdown later this year and we still have a very mild recession in our forecast. As we have said in the past, there are several reasons for us to keep this forecast call for now. First, interest rates are very high, in nominal as well as in real terms, as inflation continues to come down. Second, the Leading Economic Index (LEI) continues to show that the economy is expected to enter a recession soon. Third, the ISM Manufacturing Index has been in contraction territory for more than a year and the ISM Services Index weakened considerably at the end of last year. Fourth, we think the employment situation is even weaker than the nonfarm payroll numbers are reflecting. The reason for this is that out of all the employment sectors in the U.S. economy, a handful of them are doing the heavy lifting. That is, as the graphs below shows, the health care & and social assistance sector, professional & technical services, leisure & hospitality, construction, as well as state and local governments, are doing the heavy lifting. In December of 2023, 86% of all the jobs added were from these six sectors and 90% during the last 12 months. However, the second graph shows that these six sectors represent only 49% of all the jobs in the U.S. economy.

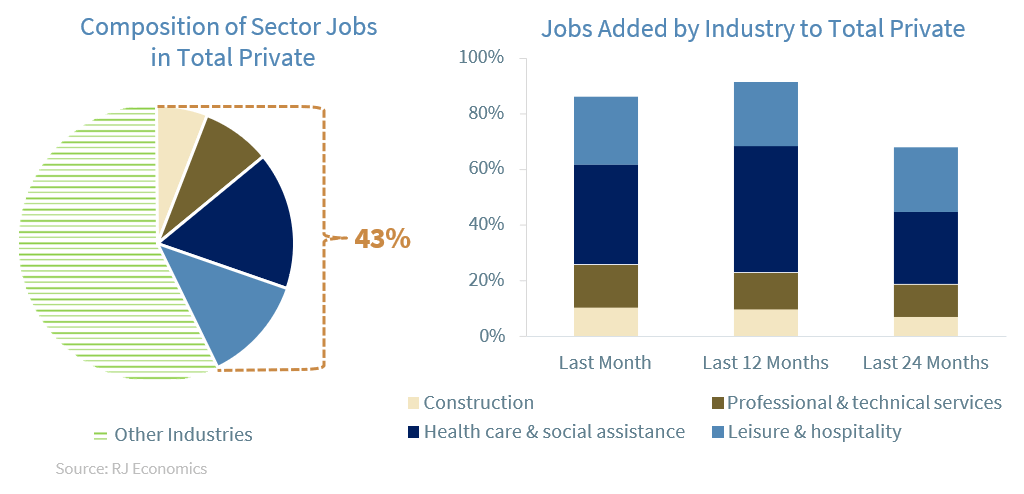
Furthermore, if we take out employment by state and local governments, that is, if we only consider employment created by the private economy, the percentage of jobs created by four of these private sectors also accounted for 86% of total private employment during the last month of 2023 while they accounted for 91% of total private employment during the last 12 months. However, these four sectors represent only 43% of total private employment.
This means that any trouble in these sectors of the U.S. economy and/or more weakness in the rest of the sectors could mean trouble for the U.S. economy going forward. The only sector that will continue to “punch above the waist” is going to be the health care & social assistance sector, which typically does well in both a strong and in a weakening economy. However, the rest of the sectors are probably going to be affected by any further slowdown in the service side of the economy. Perhaps the biggest unknown will be the construction sector, and specifically, real investment in structures, which has remained very strong even under the current high interest rate environment due to the strong effects of the CHIPS Act, the IRA, as well as the Infrastructure Bill passed several years ago. Furthermore, if we start to see a reversal in employment growth in state and local governments, then overall employment growth could start to weaken considerably over the next several months.
Economic and market conditions are subject to change.
Opinions are those of Investment Strategy and not necessarily those of Raymond James and are subject to change without notice. The information has been obtained from sources considered to be reliable, but we do not guarantee that the foregoing material is accurate or complete. There is no assurance any of the trends mentioned will continue or forecasts will occur. Last performance may not be indicative of future results.
Consumer Price Index is a measure of inflation compiled by the US Bureau of Labor Statistics. Currencies investing is generally considered speculative because of the significant potential for investment loss. Their markets are likely to be volatile and there may be sharp price fluctuations even during periods when prices overall are rising.
Consumer Sentiment is a consumer confidence index published monthly by the University of Michigan. The index is normalized to have a value of 100 in the first quarter of 1966. Each month at least 500 telephone interviews are conducted of a contiguous United States sample.
Personal Consumption Expenditures Price Index (PCE): The PCE is a measure of the prices that people living in the United States, or those buying on their behalf, pay for goods and services. The change in the PCE price index is known for capturing inflation (or deflation) across a wide range of consumer expenses and reflecting changes in consumer behavior.
The Consumer Confidence Index (CCI) is a survey, administered by The Conference Board, that measures how optimistic or pessimistic consumers are regarding their expected financial situation. A value above 100 signals a boost in the consumers’ confidence towards the future economic situation, as a consequence of which they are less prone to save, and more inclined to consume. The opposite applies to values under 100.
Certified Financial Planner Board of Standards Inc. owns the certification marks CFP®, CERTIFIED FINANCIAL PLANNER™, CFP® (with plaque design) and CFP® (with flame design) in the U.S., which it awards to individuals who successfully complete CFP Board’s initial and ongoing certification requirements.
Links are being provided for information purposes only. Raymond James is not affiliated with and does not endorse, authorize or sponsor any of the listed websites or their respective sponsors. Raymond James is not responsible for the content of any website or the collection or use of information regarding any website’s users and/or members.
GDP Price Index: A measure of inflation in the prices of goods and services produced in the United States. The gross domestic product price index includes the prices of U.S. goods and services exported to other countries. The prices that Americans pay for imports aren’t part of this index.
The Conference Board Leading Economic Index: Intended to forecast future economic activity, it is calculated from the values of ten key variables.
The Conference Board Coincident Economic Index: An index published by the Conference Board that provides a broad-based measurement of current economic conditions.
The Conference Board lagging Economic Index: an index published monthly by the Conference Board, used to confirm and assess the direction of the economy’s movements over recent months.
The U.S. Dollar Index is an index of the value of the United States dollar relative to a basket of foreign currencies, often referred to as a basket of U.S. trade partners’ currencies. The Index goes up when the U.S. dollar gains “strength” when compared to other currencies.
The FHFA House Price Index (FHFA HPI®) is a comprehensive collection of public, freely available house price indexes that measure changes in single-family home values based on data from all 50 states and over 400 American cities that extend back to the mid-1970s.
Import Price Index: The import price index measure price changes in goods or services purchased from abroad by U.S. residents (imports) and sold to foreign buyers (exports). The indexes are updated once a month by the Bureau of Labor Statistics (BLS) International Price Program (IPP).
ISM New Orders Index: ISM New Order Index shows the number of new orders from customers of manufacturing firms reported by survey respondents compared to the previous month. ISM Employment Index: The ISM Manufacturing Employment Index is a component of the Manufacturing Purchasing Managers Index and reflects employment changes from industrial companies.
ISM Inventories Index: The ISM manufacturing index is a composite index that gives equal weighting to new orders, production, employment, supplier deliveries, and inventories.
ISM Production Index: The ISM manufacturing index or PMI measures the change in production levels across the U.S. economy from month to month.
ISM Services PMI Index: The Institute of Supply Management (ISM) Non-Manufacturing Purchasing Managers’ Index (PMI) (also known as the ISM Services PMI) report on Business, a composite index is calculated as an indicator of the overall economic condition for the non-manufacturing sector.
Consumer Price Index (CPI) A consumer price index is a price index, the price of a weighted average market basket of consumer goods and services purchased by households. Changes in measured CPI track changes in prices over time.
Producer Price Index: A producer price index (PPI) is a price index that measures the average changes in prices received by domestic producers for their output.
Industrial production: Industrial production is a measure of output of the industrial sector of the economy. The industrial sector includes manufacturing, mining, and utilities. Although these sectors contribute only a small portion of gross domestic product, they are highly sensitive to interest rates and consumer demand.
The NAHB/Wells Fargo Housing Opportunity Index (HOI) for a given area is defined as the share of homes sold in that area that would have been affordable to a family earning the local median income, based on standard mortgage underwriting criteria.
The S&P CoreLogic Case-Shiller U.S. National Home Price NSA Index measures the change in the value of the U.S. residential housing market by tracking the purchase prices of single-family homes.
The S&P CoreLogic Case-Shiller 20-City Composite Home Price NSA Index seeks to measures the value of residential real estate in 20 major U.S. metropolitan.
Source: FactSet, data as of 7/7/2023
Markets & Investing Members of the Raymond James Investment Strategy Committee share their views on...
Markets & Investing Review the latest Weekly Headings by CIO Larry Adam. Key Takeaways ...
Technology & Innovation Learn about a few simple things you can do to protect your personal information...