Read the weekly bond market commentary from Drew O’Neil.
There has been a lot of talk about rising interest rates, the flattening of the yield curve, the potential for an inverted curve and the possibility that a recession could ensue. Are these relevant observations and how does all of this impact fixed income strategy?
The following graph depicts the 2- to 10-year Treasury spread (blue line) versus Fed Funds rate (red line) from 1986 through the last U.S. recession. When the blue line falls below the horizontal axis, the yield curve is inverted (shorter maturities yield more than longer maturities). This timeframe includes 4 periods of major Fed rate hikes, 3 periods of lengthy Fed rate cuts, 3 recessions and 3 inverted yield curves:
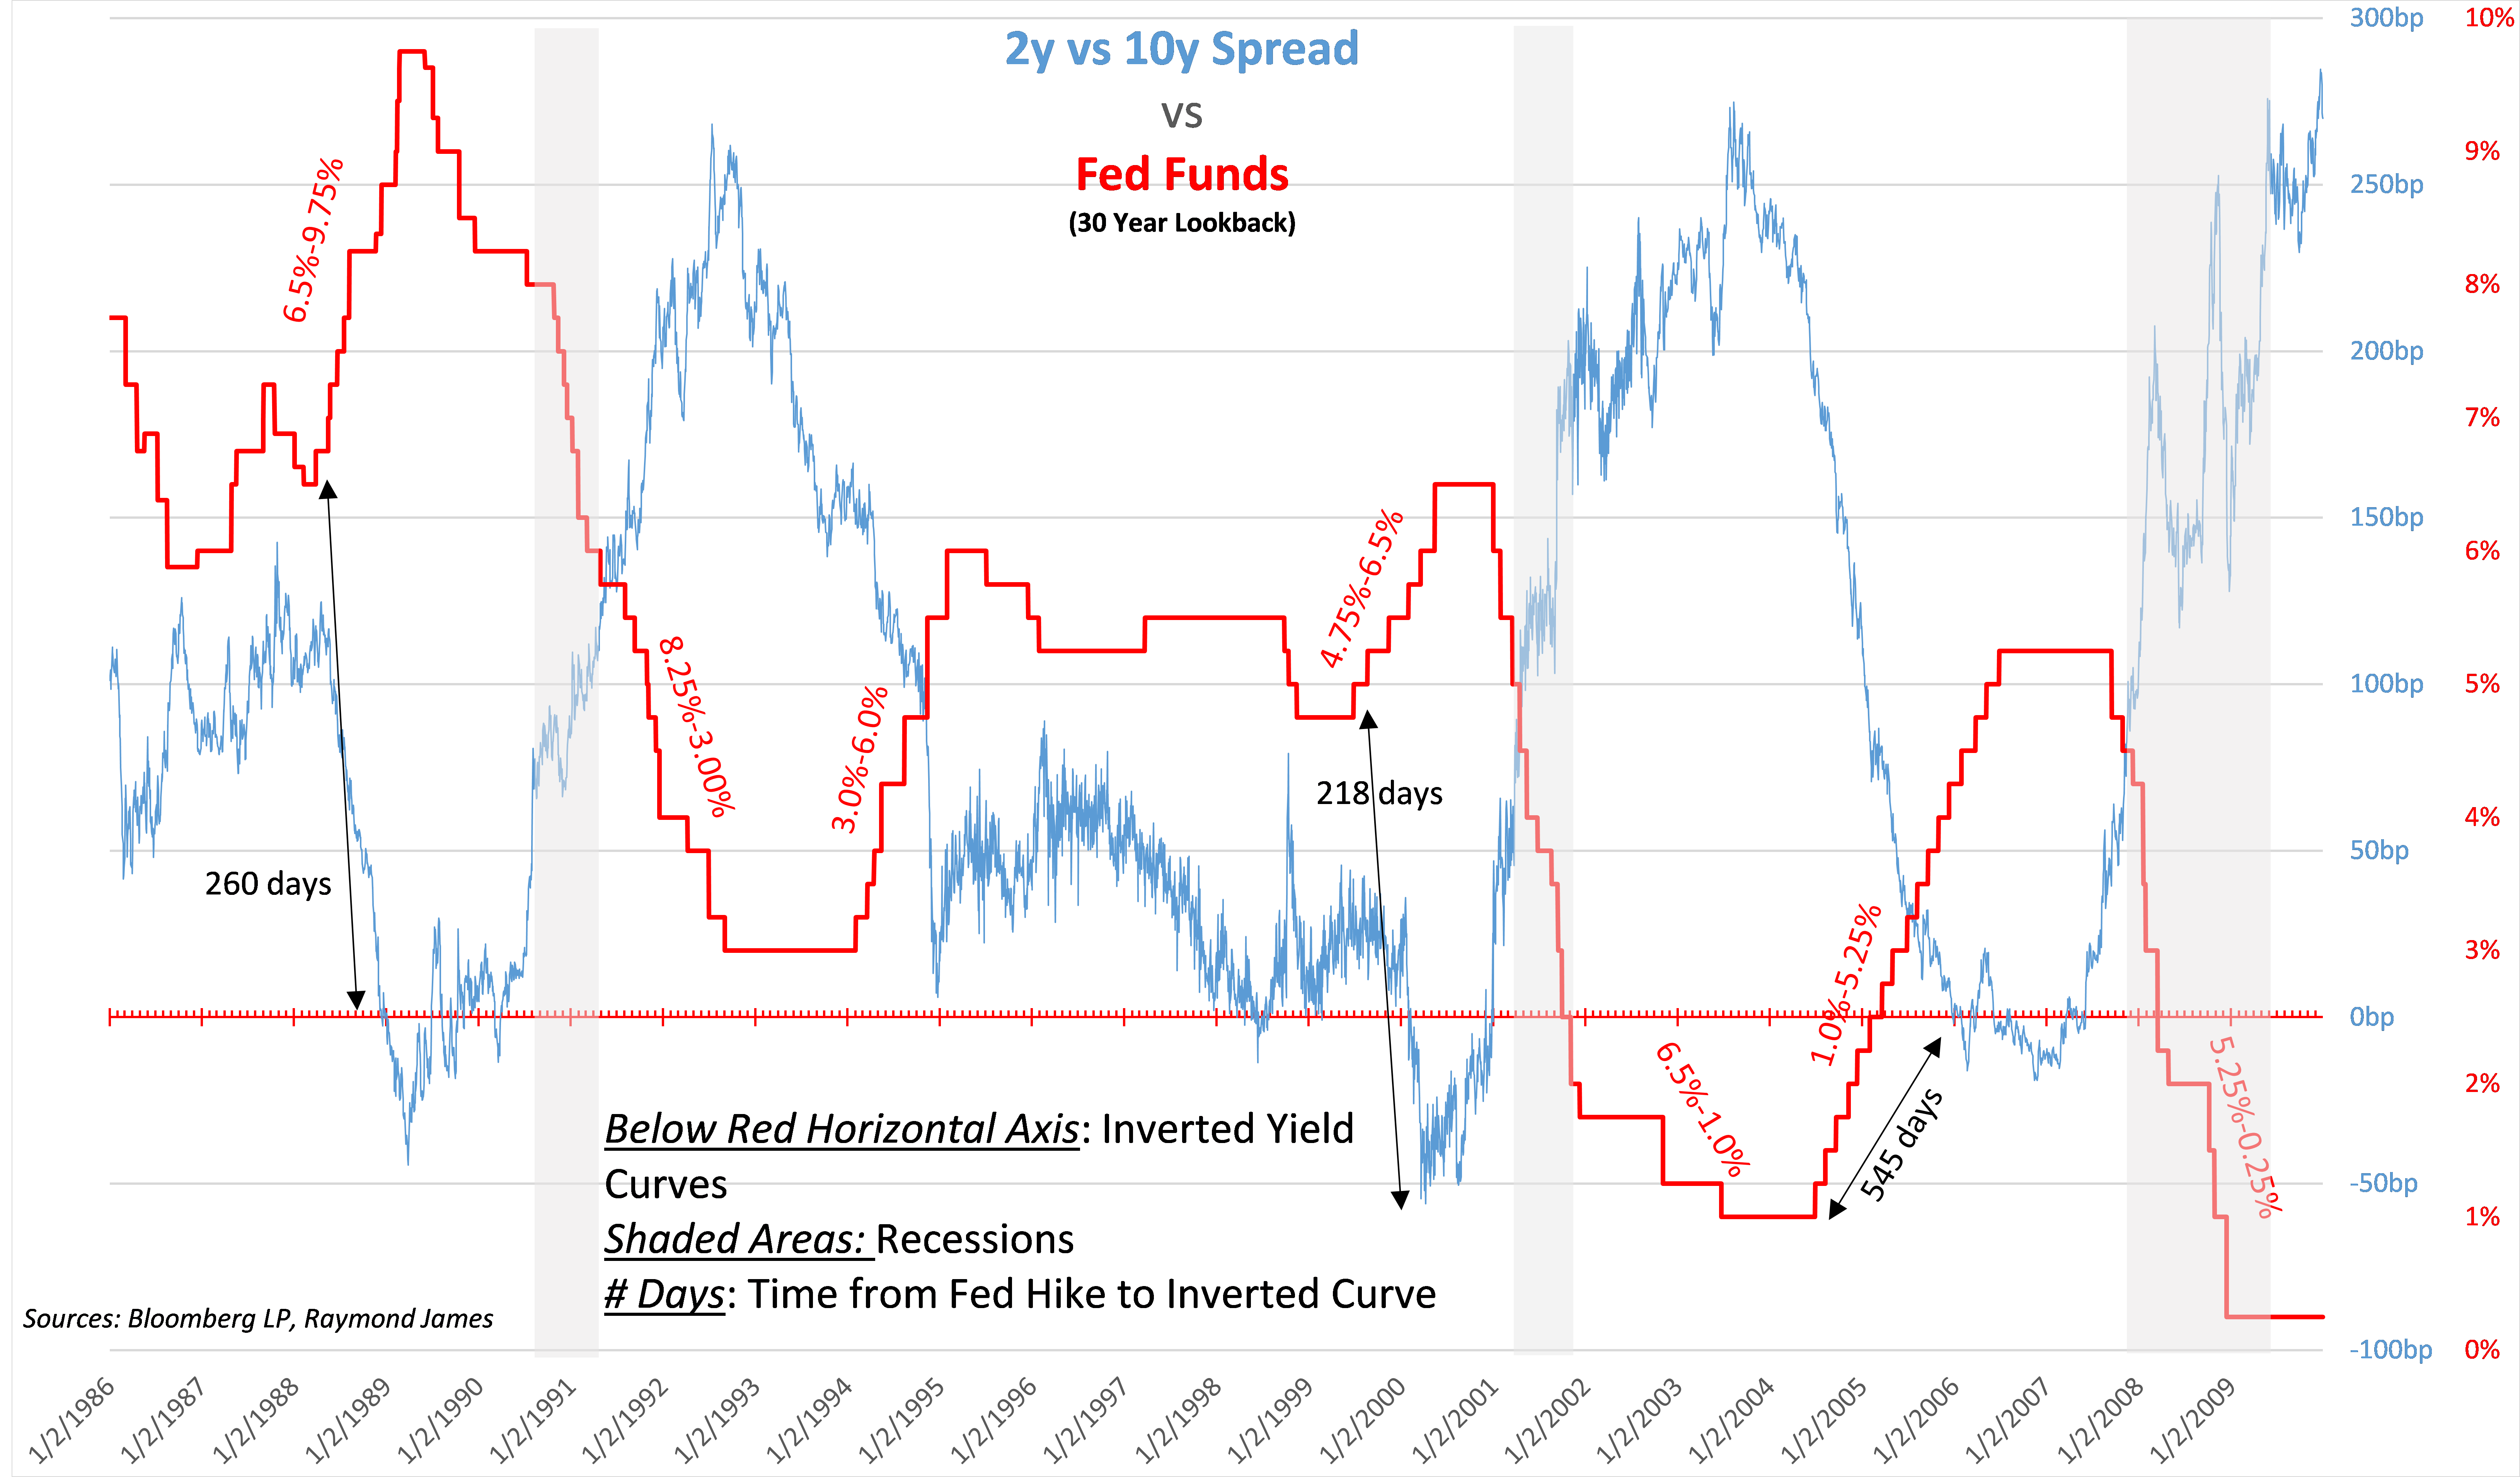
Remembering that past history is not necessarily an indicator of the future, there are several interesting observations:
- Since January 1986, the yield curve has been positively sloped (long maturities have higher yields than short maturities) 92% of the time.
- Inverted curves lasted approximately a year on average (8 months to 1.5 years).
- Within a year and a half after the start of the major Fed rate hike period, the yield curve inverted 3 out of 4 times. During the other rate hike period, the curve flattened and actually went inverted but didn’t sustain inversion until the next Fed push.
- From the start of inversion, a recession occurred approximately 1.5-3 years later. From the end of the inversion, the recession occurred within 7 months or less.
- It can be argued that the Fed attempts to get ahead of inflation by hiking short term rates or perhaps that they overshoot their mark, creating too much of an economic slowdown resulting in a recession.
- Differences to note which does not infer we won’t see a recession but probably is changing the typical timelines:
- The Fed never grew the balance sheet (created money) to the extent they did between December 2008 and September 2012. The balance sheet peaked in January 2015 at $4.5 trillion.
- The Fed kept Zero Interest Rate Policy (ZIRP) for over 7 years.
- The pace of Fed hikes is elongated. It may suggest that previous purpose was to get ahead of inflation versus attempting to level rates near “neutrality”, somewhere around a 3.00% Fed Funds level.
Let’s isolate the last 10 years:
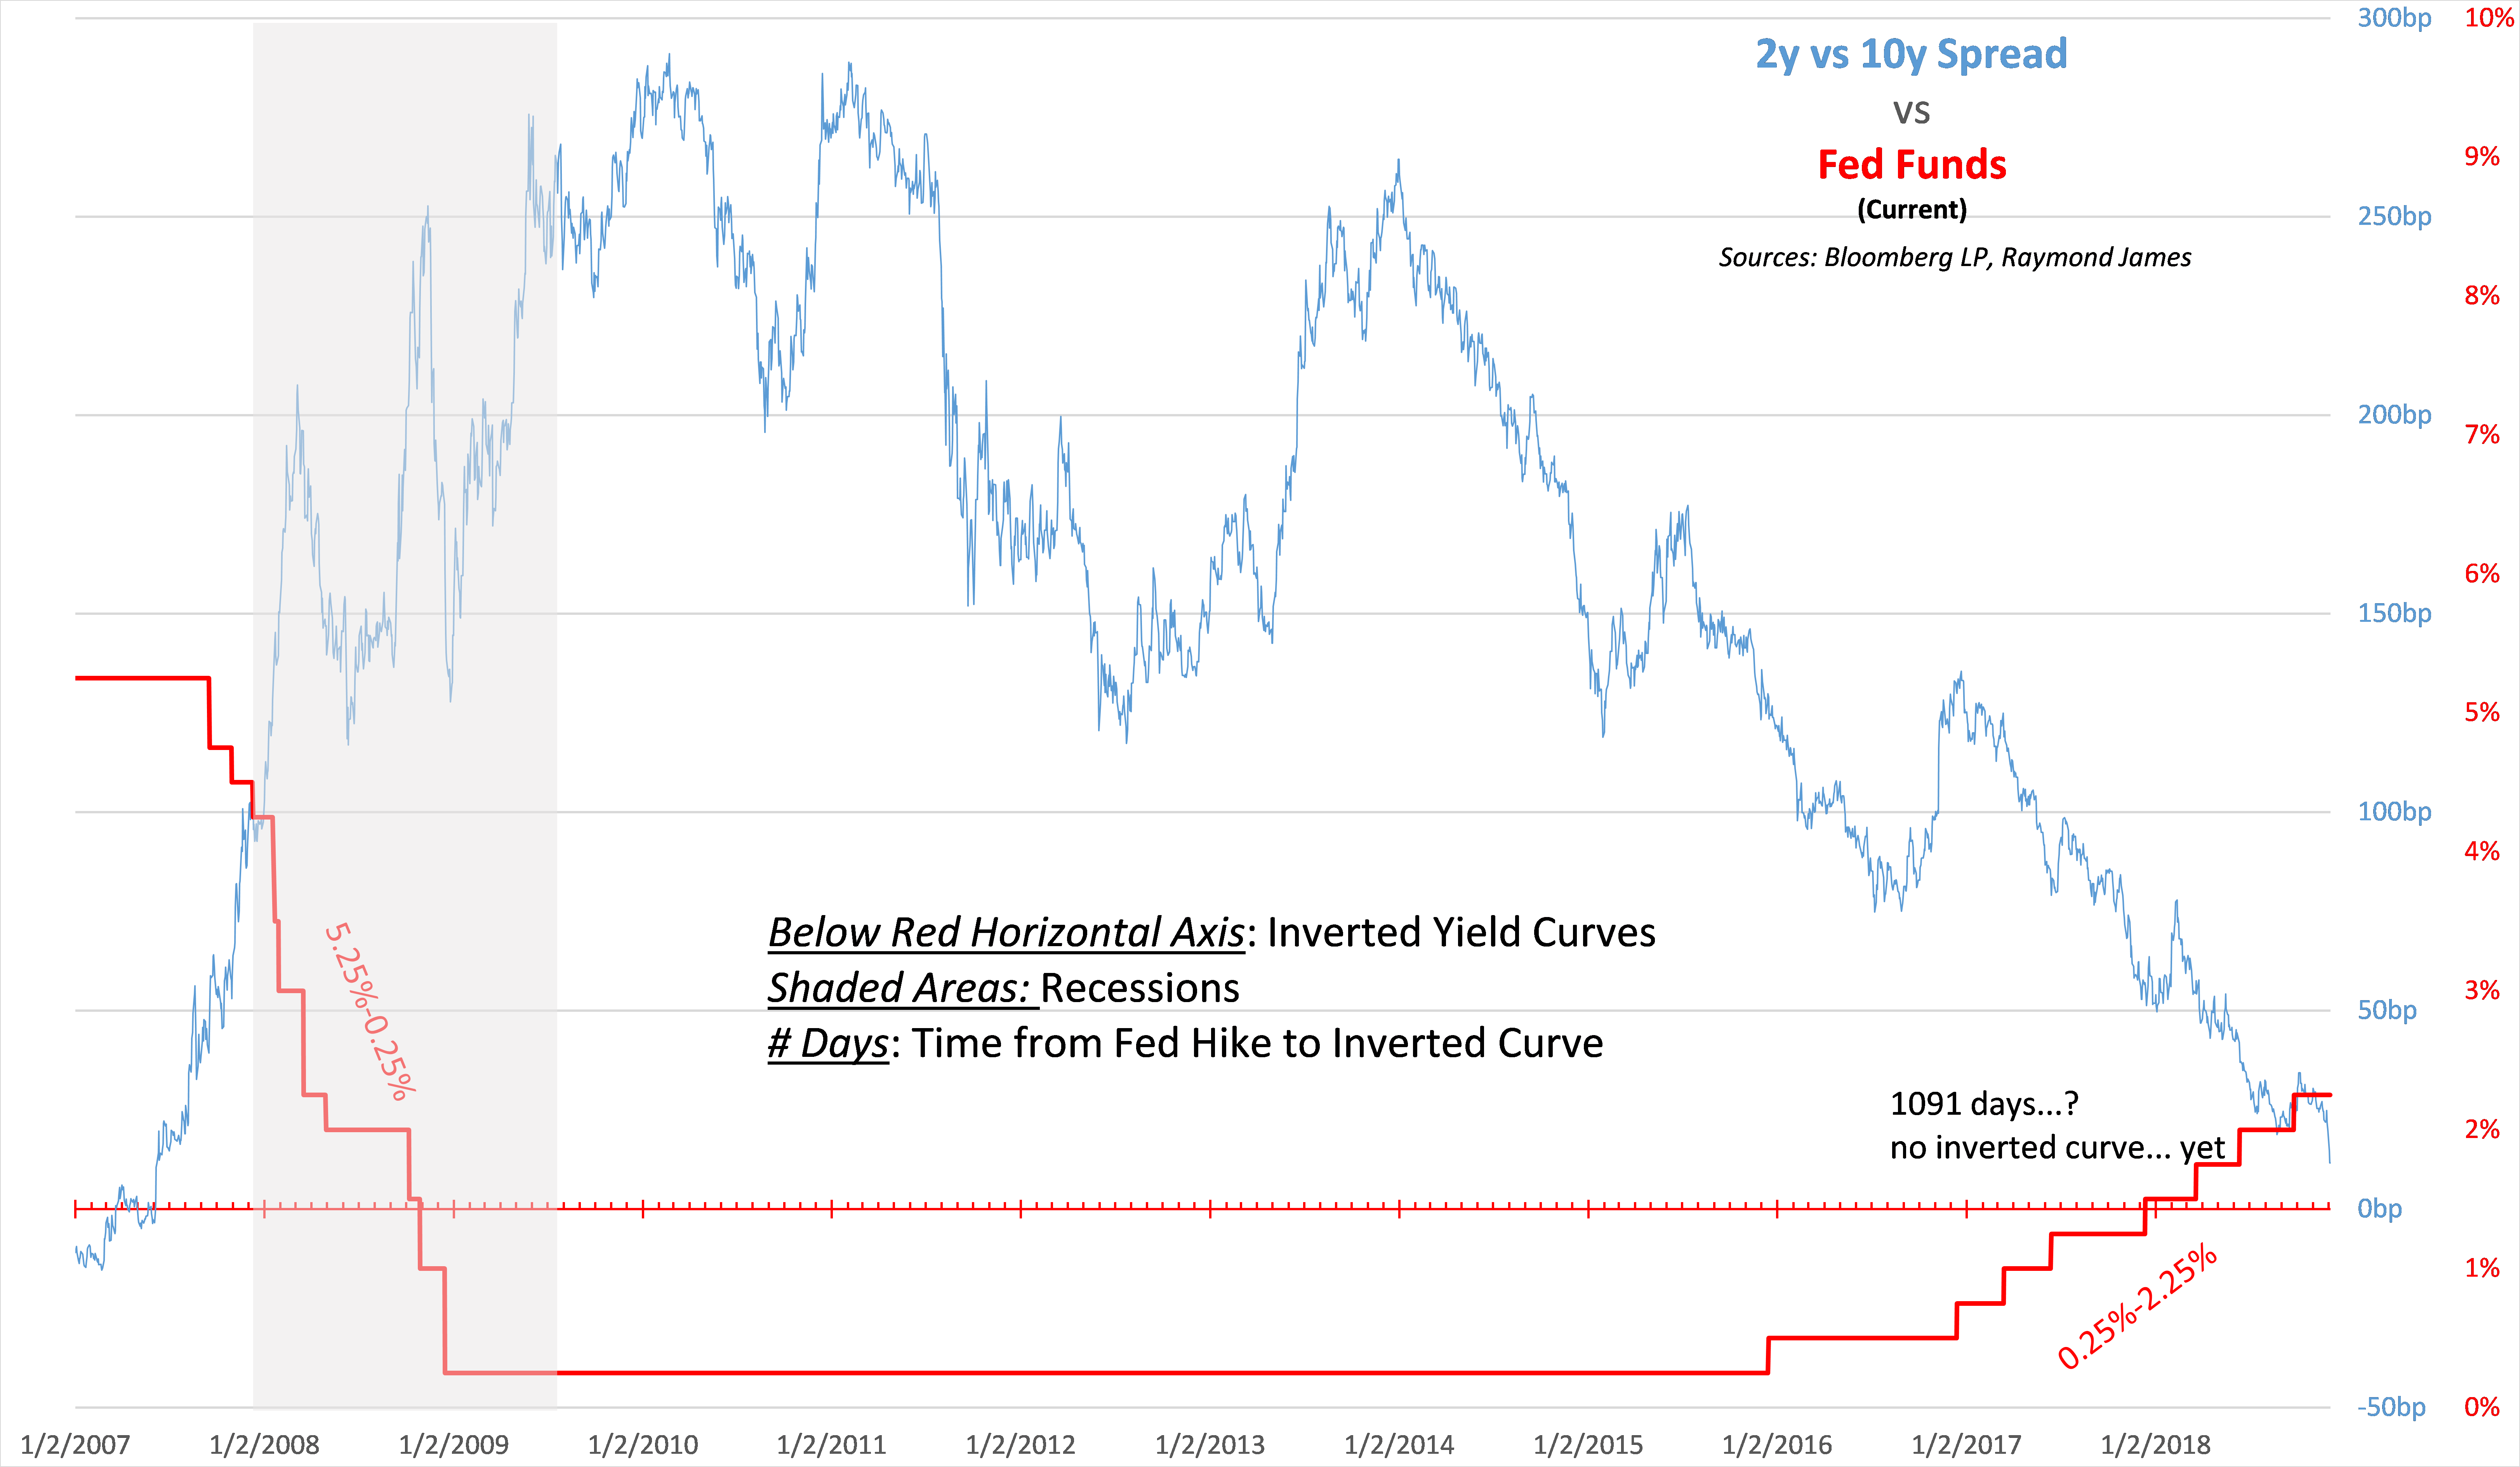
This relaxed pace has influenced mainly short-term rates. This is an important point, noting that recent flattening of the yield curve was driven mostly by rising short term rates. The recent 10 year Treasury trend has mirrored the long term general interest rate trend. There is no correlation to the noticeably more irregular slope or spread between the 2- and 10-year. (see the graph on the next page)
A common thought when the curve flattens is to shorten investment maturities. For example, on July 3, 2000, the 10-year Treasury was 5.99%. The 2-year was 6.29%. Pick-up yield AND shorten up! Two years later (July 3, 2002) when the 2-year Treasury matured, investors faced a much different rate environment with reinvestment choices on the 2- and 10-year at 2.79% and 4.76% respectively (note investment decision consequences in box). Clearly hindsight divulges why an inverted curve does not necessarily dictate that staying short is the answer. When planning fixed income strategy/allocation, the impulse to predict future rates needs to acquiesce to long-term planning. Even with interest rates much lower across the board, geopolitical uncertainty, lack of inflation and interest rate disparity may be formidable barriers to higher domestic rates.
2000 Investment/ Reinvestment Choices & Resulting Yield
10 years @ 5.99%
OR
2 years @ 6.29%
2 years @ 2.79%
2 years @ 2.52%
2 years @ 5.17%
2 years @ 2.53%
(Weighted avg = 3.86%)
OR
2 years @ 6.29%
8 years @ 3.98%
(Weighted avg = 4.42%)
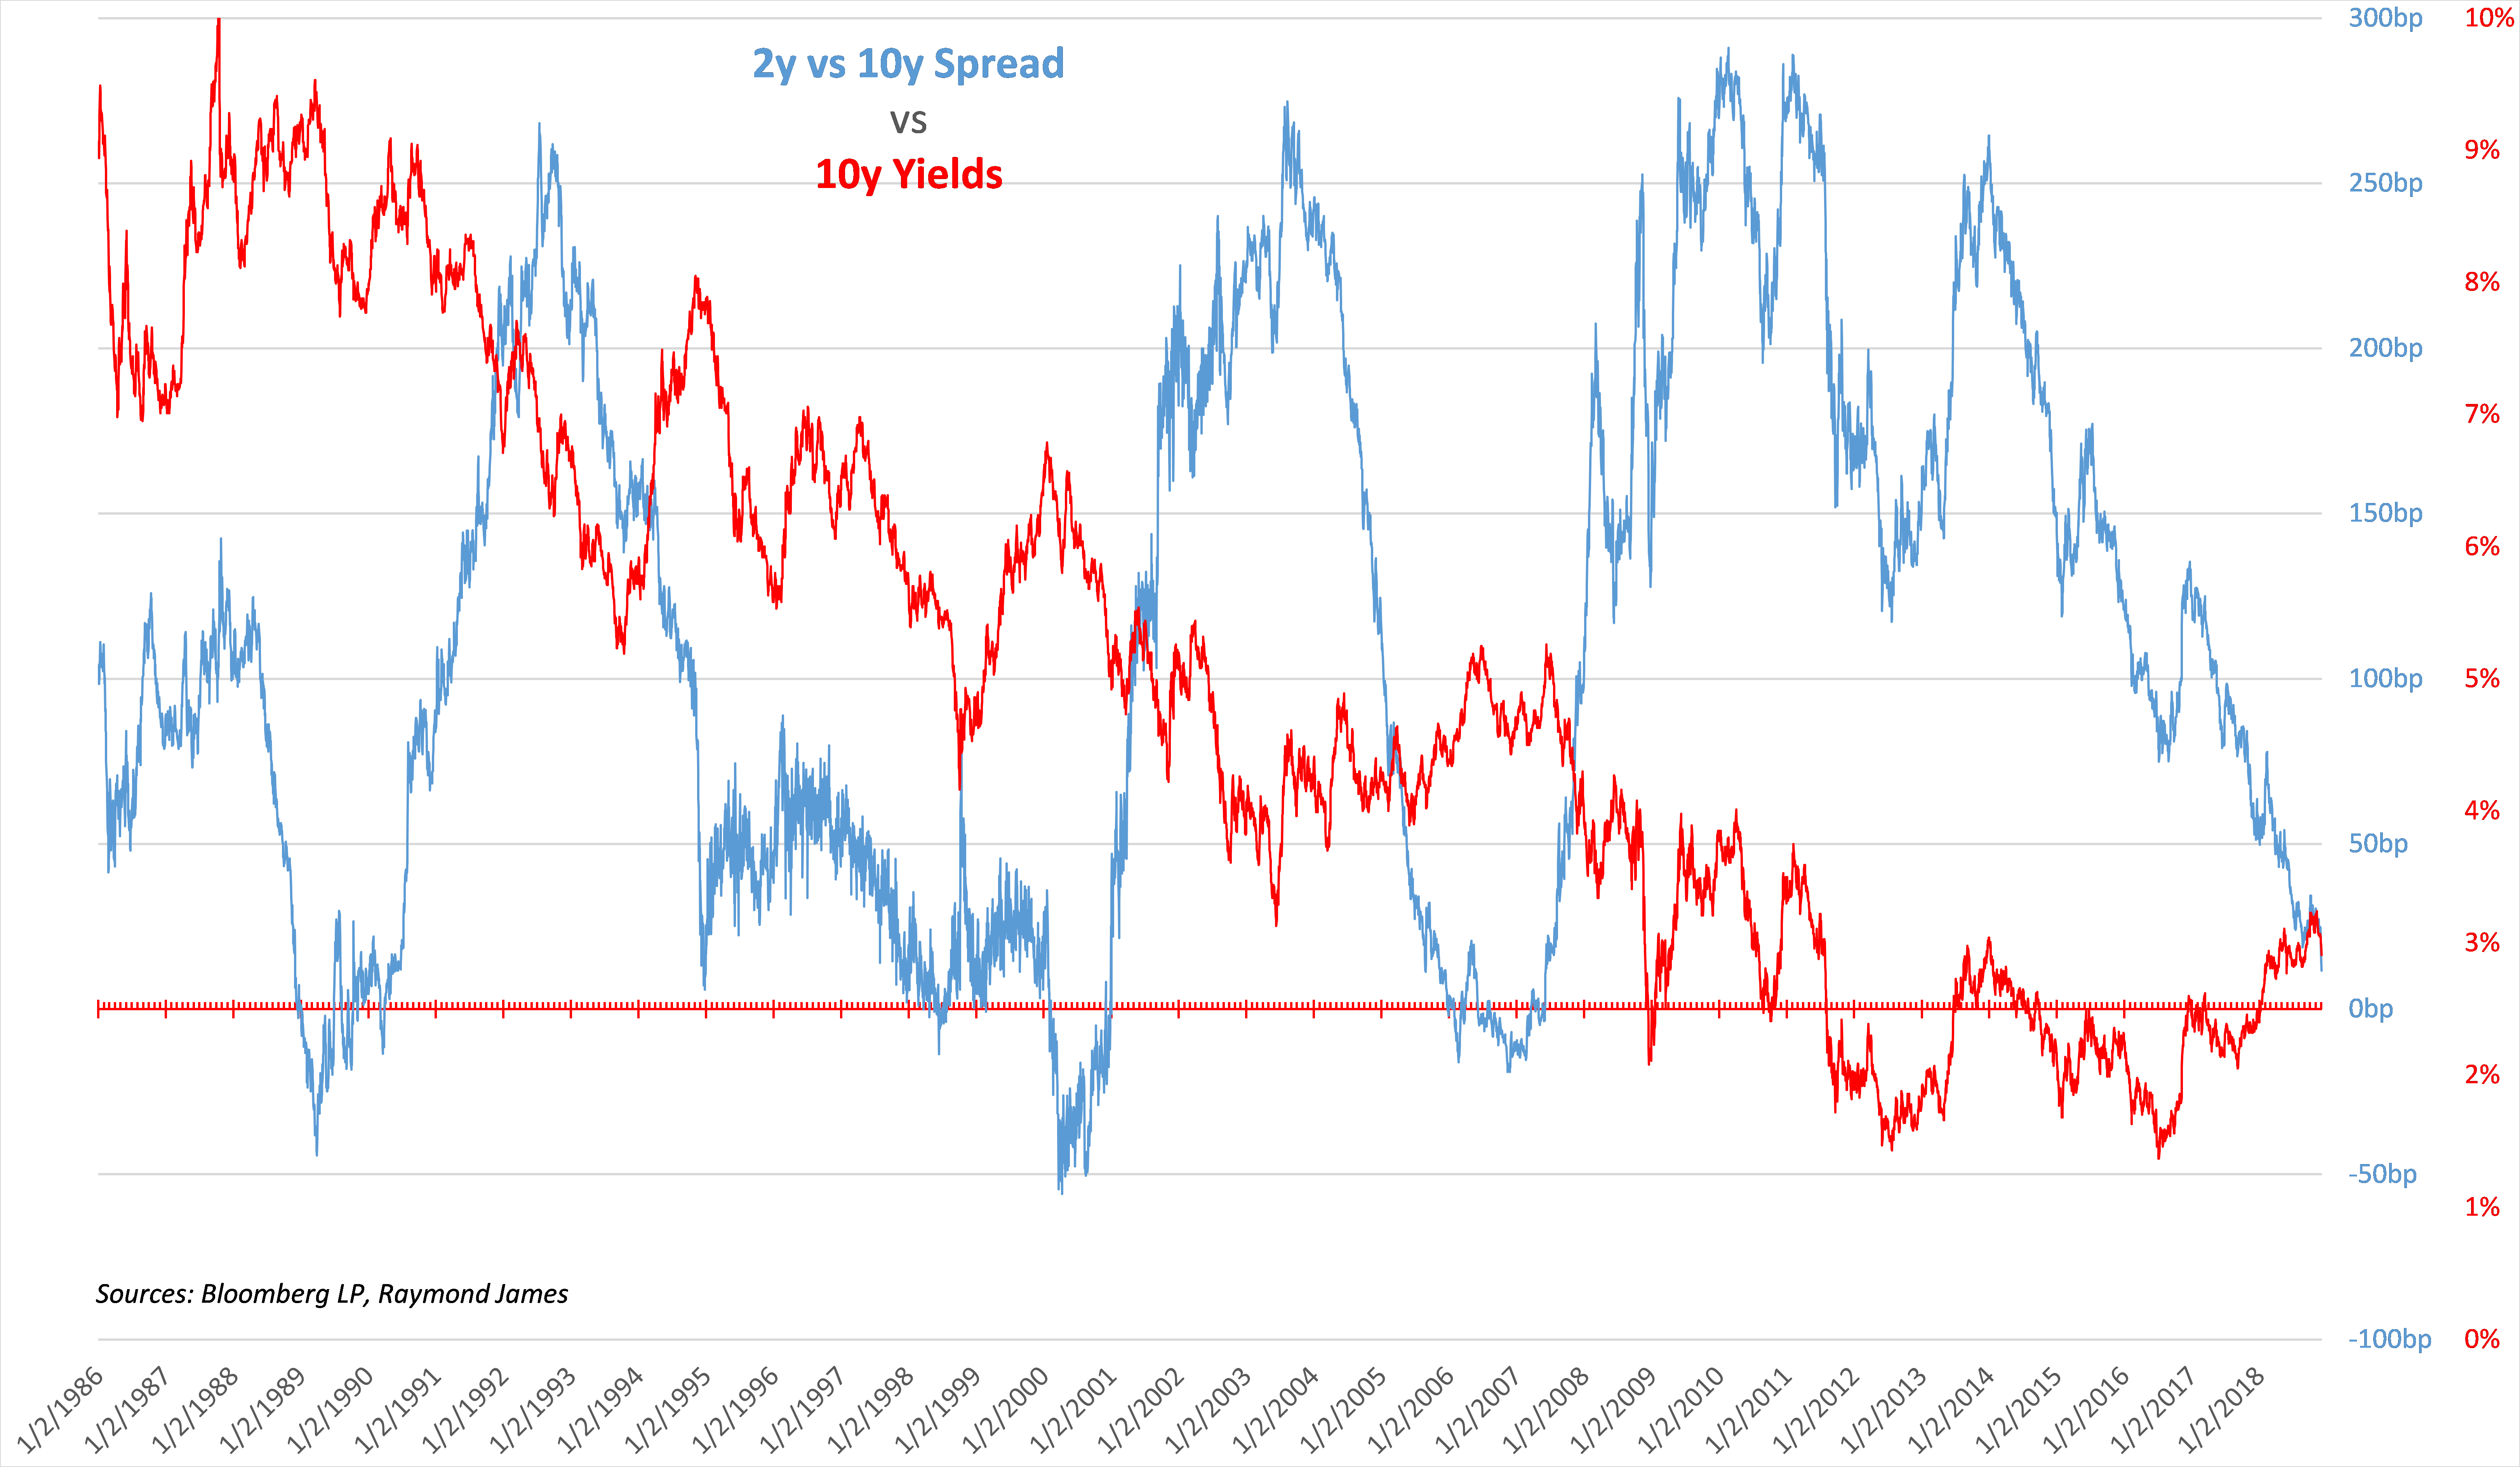
- The general 10-year Treasury interest rate trend (red line) has been a decline albeit not linear. In contrast, the yield curve shape (blue line) has jumped up and down over the same period. One may postulate that the shorter end of the Treasury curve is creating the spread volatility between the short and long end.
- Another way to view this is that all points on the Treasury curve do not move in unison. While the Fed can directly influence short term rates, the longer end of the curve is influenced by other factors such as the market, economic data and inflation (or lack of).
Many investors utilize fixed income securities as the foundation of their portfolio. Rationale may be quite different versus that for growth asset investing. In order to strategically combat the man-made and natural market forces, it may take the discipline of long term planning.
- Short-term thinking may imply that a flat curve dictates short term buying. However, as depicted in the graphs, in the past when the curve was flat, hindsight demonstrates that short buying turned out to be a less desirable action. On the other hand, as interest rates have continued to decline, it is more reasonable to presume interest rates will eventually rise. Since predicting interest rate direction and perhaps more importantly, market “timing” proves near impossible, the engineered strategy may be to ladder maturities/duration and thus potentially mitigate this dilemma.
- The appropriate fixed income products used to fill in a laddered strategy change with spread and yield. Currently, the short end of the ladder (< 5 years) may be optimized with CDs and corporate bonds. This, right now, holds for investors in the lowest as well as highest Federal tax brackets.
To learn more about the risks and rewards of investing in fixed income, please access the Securities Industry and Financial Markets Association’s “Learn More” section of investinginbonds.com, FINRA’s “Smart Bond Investing” section of finra.org, and the Municipal Securities Rulemaking Board’s (MSRB) Electronic Municipal Market Access System (EMMA) “Education Center” section of emma.msrb.org.
The author of this material is a Trader in the Fixed Income Department of Raymond James & Associates (RJA), and is not an Analyst. Any opinions expressed may differ from opinions expressed by other departments of RJA, including our Equity Research Department, and are subject to change without notice. The data and information contained herein was obtained from sources considered to be reliable, but RJA does not guarantee its accuracy and/or completeness. Neither the information nor any opinions expressed constitute a solicitation for the purchase or sale of any security referred to herein. This material may include analysis of sectors, securities and/or derivatives that RJA may have positions, long or short, held proprietarily. RJA or its affiliates may execute transactions which may not be consistent with the report’s conclusions. RJA may also have performed investment banking services for the issuers of such securities. Investors should discuss the risks inherent in bonds with their Raymond James Financial Advisor. Risks include, but are not limited to, changes in interest rates, liquidity, credit quality, volatility, and duration. Past performance is no assurance of future results.