With a debt ceiling agreement reached in principle, CIO Larry Adam looks at how this development – pending passage through the House and Senate – impacts his team’s respective market and economic views.
To read the full article, see the Thoughts on the Market publication linked below.
After weeks of drama in Washington D.C., the White House and House Speaker Kevin McCarthy came to a debt ceiling agreement over the weekend. Assuming the deal passes both the House and the Senate, it avoids a potential default with the ‘X’ date (the date when the Treasury Department runs out of money) currently expected to be June 5. In its current state, the agreement implements cuts to future spending growth in 2024 and 2025 (non-defense spending would be relatively flat in 2024 and rise only 1% in 2025), calls for non-binding spending cuts over the following four years, and suspends the debt ceiling through January 2025. This marks the 79th time since the 1960s that the debt ceiling has been raised or suspended, and it is worth noting that a suspension in the debt ceiling is not uncommon in recent history, as the debt ceiling has been suspended over 60% of the time over the last 10 years.
What were some of the biggest takeaways from the deal?
The final agreement followed the outline that we have been describing for the past few weeks. The biggest takeaways from the debt ceiling deal were raising the debt limit through January 2025, cuts to non-defense discretionary spending that were shallower and shorter in duration than widely expected (thus likely having less of an impact on GDP), modest updates to energy permitting rules that will serve as a first step toward more comprehensive reforms, enhanced work requirements for federal aid, reduced IRS funding, and the rescission of unspent COVID funding.
In the end, the easiest part of our debt ceiling framework was accomplished: the debt ceiling was altered (in this case suspended) to afford the ability to increase the country’s debt burden. As far as putting the U.S. on a more sustainable fiscal path and solving our long-term debt issues, the elephant in the room (e.g., modifying mandatory spending programs such as Social Security and Medicaid) was not addressed which will continue to strain our revenue resources moving forward. And as far as establishing these spending cuts for the future, the cuts are technically only binding for two years as this Congress cannot bind the next Congress which will be seated in January 2025. As a result, this issue is likely to be debated in the upcoming presidential election.
Do you think the agreement will pass the House and the Senate?
We are generally optimistic about the passage of the deal to raise the debt limit through January 2025 and its overall market impact. The political necessity to pass the deal to avoid default and the growing moentum behind the bill supports the likelihood of its successful passage, despite vocal dissatisfaction from certain Republican and Democratic factions regarding the terms of the deal— Republican narratives supporting the deal will likely focus on what was included (especially permitting reform, restrictions on executive spending, IRS funding cuts, spending cuts, and work requirements for federal aid), while Democratic narratives will likely focus on what was not included (i.e., “cuts could have been worse”).
With the extreme sides of both parties (e.g., Progressives and Freedom Caucus) likely to remain disappointed and not vote for the bill, passage will likely be bipartisan to include more moderate Republicans and Democrats. The larger the margin of victory in the House, the less the Senate will seek amendments to change the bill.
What is the impact on the economy and Federal Reserve policy?
Perhaps the most important positive economic effect of the passage of the debt ceiling bill by the U.S. Congress is going to be a reduction in the uncertainty the debt ceiling debate created and the fact that the issue is not going to come back to haunt markets until, at least, January of 2025. The deal calls for a two-year suspension of the debt ceiling, which means that there is no pre-set limit, and thus the U.S. Treasury can borrow as much as it needs to pay the country’s bills. The most negative economic effect will probably be that our political system is, once again, punting the debt ceiling issue forward so we are certain to be revisiting the issue in about two and a half years.
The major provision of the deal is a two-year cap on federal discretionary spending. Federal discretionary spending represents about 25% of total federal spending. The effect of the debt ceiling, if approved, will probably have little effect on GDP growth in 2023 coming from cuts to federal government expenditures and will probably shave GDP growth in 2024 by about 0.1%. Perhaps the biggest concern in the debt ceiling agreement is the resumption of student loan payments that could start in September of this year. The restart in student loans could affect consumer discretionary spending and could dampen personal consumption expenditures going forward.
All of the potential effects of the deal would indicate that the Fed should remain vigilant on the US economy but that its work has probably ended for this tightening cycle. Our expectation is that the effects of the debt ceiling deal will be slightly disinflationary, coming from lower government expenditures as well as lower discretionary personal consumption expenditures. This means that slightly lower GDP growth will be positive for a continuation of the disinflationary process and that the Fed is done with its interest increases for this tightening cycle.
Are you still confident in your 4,400 year-end target for the S&P 500?
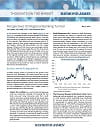
If the deal passes, the reduction in uncertainty will be a net positive for the equity market. However, it is worth noting that the S&P 500 has been fairly resilient throughout the debt ceiling debate and is now at the highest level since August 2022 (up 10.3% year-to-date). This is largely due to market participants becoming more accustomed to brinkmanship and last-minute deals emanating from Washington.
More important, as the drama hopefully fades, focus will turn to fundamental factors such as economic growth, inflation, the Fed and earnings. And the reality is, these factors are turning more positive for the equity market over the near to medium term. Take inflation for example. The pace of inflation has already decelerated from 6.4% YoY at the start of the year to 5.0% YoY currently, and calendar effects should push inflation to a 3-handle by July. A cooling of inflation should allow for the Fed’s May hike to be the final of this tightening cycle, and both easing inflation and a less aggressive Fed have historically led to an expansion in equity multiples (year-end 2023 P/E target: 20.5x). This, combined with the stabilization in future earnings estimates (S&P 500 2023 EPS target: $215), the resilience of the economy, and solid 1Q23 earnings results, should lead to upside from current levels.
While we do not expect the market to continue at the pace that we have seen thus far year-to-date (+~10%) as sentiment has improved significantly since the start of the year (leading to less of a contrarian trade), an expansion in multiples and resilience in earnings (2023 and 2024 earnings have started to trend higher) leave us confident in our 4,400 target (~5% upside from current levels).
What is the impact of increasing treasury issuance on interest rates?
The news of a debt ceiling agreement, while not yet passed, is a positive development for the fixed income markets as it reduces the odds of a U.S. debt default. This has led to a narrowing in credit default swap spreads from a peak of 176 to ~140 and to lower yields on near-term Treasury bill maturities, which topped 6.50% in recent weeks. Assuming the debt deal passes, and we have high confidence that it will, market attention will turn to renewed fixed income issuance, particularly as the Treasury seeks to replenish its coffers, the Fed’s upcoming rate decision and the longer- term growth implications of the modest spending caps.
Yields have backed up considerably since early May as market expectations for the Fed have shifted toward the potential for another near-term rate hike, but we believe the combination of modest spending cuts and tighter liquidity conditions will remain a headwind to growth and inflation – and ultimately be bond market supportive. While increased issuance may weigh on Treasury yields in the near term, we forecast the 10-year Treasury yield will grind lower over the remainder of the year as growth and inflation subside.
Bottom line
Over the last few weeks, we have highlighted that it was our base case that cooler heads would prevail in Washington and that both sides would come to an agreement to avoid a default. The contours of a deal have been in place for a few weeks and there was no political incentive to force a default. The framework of the deal is, for the most part, in line with our expectations, and therefore does not have a material impact on our asset class views and targets.
In the end, neither the Republicans nor Democrats were a clear winner with both sides expressing some disappointment. But as the old adage says, “a good compromise is when both parties are dissatisfied.” As a result, volatility could be resurrected over the next several days as the deal works its way through the House and Senate, although we believe it has the support to pass.
While the suspension of the debt ceiling does push the can down the road and volatility will likely continue to emanate from Washington (albeit at a more moderate pace), we expect investors to continue to look beyond this volatility and instead focus on the long-term drivers of asset class performance such as the strength of the economy, the trajectory of monetary policy and earnings growth.
Read the full
Thoughts on the Market
All expressions of opinion reflect the judgment of the author(s) and the Investment Strategy Group, but not necessarily those of Raymond James & Associates, and are subject to change. This information should not be construed as a recommendation. The foregoing content is subject to change at any time without notice. Content provided herein is for informational purposes only. There is no guarantee that these statements, opinions or forecasts provided herein will prove to be correct. Economic and market conditions are subject to change. Investing involves risks including the possible loss of capital. Material is provided for informational purposes only and does not constitute a recommendation. Diversification and asset allocation do not ensure a profit or protect against a loss.
The information has been obtained from sources considered to be reliable, but we do not guarantee that the foregoing material is accurate or complete. Diversification and asset allocation do not ensure a profit or protect against a loss.
INTERNATIONAL INVESTING| International investing involves additional risks such as currency fluctuations, differing financial accounting standards, and possible political and economic instability. These risks are greater in emerging markets.
OIL Investing in oil involves special risks, includingthepotentialadverseeffectsofstateandfederalregulationandmaynot be suitable for all investors.
The Consumer Price Index (CPI) | is a measure of inflation compiled by the US bureau of Labor Studies.
Personal Consumption Expenditure Price Index | The PCE is a measure of the prices that people living in the United States, or those buying on their behalf, pay for goods and services.
DESIGNATIONS
Certified Financial Planner Board of Standards Inc. owns the certification marks CFP® and CERTIFIEDFINANCIALPLANNER™ in the U.S.
Investments & Wealth Institute TM (The Institute) is the owner of the certification marks “CIMA” and “Certified Investment Management Analyst. ”Use of CIMA and/or CertifiedInvestmentManagementAnalystsignifiesthattheuserhassuccessfully completed The Institute’s initial and ongoing credentialing requirements for investment management professionals.
CFA® and Chartered Financial Analyst® are registered trademarks owned by CFA Institute. FIXED INCOME DEFINITION
AGGREGATEBOND| Bloomberg USAgg Bond Total Return Index: The index is a measure of the investment grade, fixed-rate, taxable bond market of roughly 6,000 SEC-registered securities with intermediate maturities averaging approximately 10 years. The index includes bonds from the Treasury, Government-Related, Corporate, MBS, ABS, and CMBS sectors.
HIGHYIELD| Bloomberg US Corporate High Yield Total Return Index: The index measures the USD-denominated, high yield, fixed-rate corporate bond market. Securities are classified as high yield if the middle rating of Moody’s, Fitch and S&P is Ba1/ BB+/BB+ or below.
S&P 500 |The S&P Total Return Index: The index is widely regarded as the best single gauge of large-cap U.S. equities. There is over USD 7.8 trillion benchmarked to the index, with index assets comprising approximately USD 2.2 trillion of this total. The index includes 500 leading companies and captures approximately 80% coverage of available market capitalization.
KBW REGIONAL BANKING INDEX | The KBW Regional Banking Index is a benchmark stock index for the regional banking sector representing small to medium U.S. national regional banks.
RUSSELL 2000 INDEX |The Russell 2000 Index is a small-cap U.S. stock market index that makes up the smallest 2,000 stocks in the Russell 3000 Index.
NFIB SMALL BUSINESS OPTIMISIM INDEX | A composite of ten seasonally adjusted components, providing an indication of the health of small businesses in the US.
INTERNATIONAL DISCLOSURES FOR CLIENTS IN THE UNITED KINGDOM | For clients of Raymond James Financial International Limited (RJFI): This document and any investment to which this document relates is intended for the sole use of the persons to whom it is addressed, being persons who are Eligible Counter parties or Professional Clients as described in the FCA rules or persons describedin Articles 19(5) (Investment professionals) or 49(2) (high net worth companies, unincorporated associations, etc.) of the Financial Services and Markets Act 2000 (Financial Promotion) Order 2005 (as amended)or any other person to whom this promotion may lawfully be directed. It is not intended to be distributed or passed on, directly or indirectly, to any other class of persons and may not be relied upon by such persons and is, therefore, not intended for private individuals or those who would be classified as Retail Clients.
FOR CLIENTS OF RAYMOND JAMES INVESTMENT SERVICES, LTD.: This document is for the use of professional investment advisers and managers and is not intended for use by clients.
FOR CLIENTS IN FRANCE | This document and any investment to which this document relates is intended for the sole use of the persons to whom it is addressed, being persons who are Eligible Counterparties or Professional Clients as described in “Code Monetaire et Financier” and Reglement General de l’Autorite des marches Financiers. It is not intended to be distributed or passed on, directly or indirectly, to any other class of persons and may not be relied upon by such persons and is, therefore, not intended for private individuals or those who would be classified as Retail Clients.
FOR CLIENTS OF RAYMOND JAMES EURO EQUITIES | Raymond James Euro Equities is authorised and regulated by the Autorite de Controle Prudentiel et de Resolution and the Autorite des Marches Financiers.
FOR INSTITUTIONAL CLIENTS IN THE EUROPEAN ECONOMIC AREA (EE) OUTSIDE OF THE UNITED KINGDOM | This document (and any attachments or exhibits hereto) is intended only for EEA institutional clients or others to whom it may lawfully be submitted.
FOR CANADIAN CLIENTS | This document is not prepared subject to Canadian disclosure requirements, unless a Canadian has contributed to the content of the document. In the case where there is Canadian contribution, the document meets all applicable IIROC disclosure requirements.
Source: FactSet, as of 5/30/2023
INTERNATIONALHEADQUARTERS:THERAYMONDJAMESFINANCIALCENTER 880 CARILLONPARKWAY// ST. PETERSBURG, FL 33716 // 800.248.8863 RAYMONDJAMES.COM
© 2023 Raymond James & Associates, Inc., member New York Stock Exchange/SIPC. © 2023 Raymond James Financial Services, Inc., member FINRA/SIPC. Investment products are: not deposits, not FDIC/NCUA insured, not insured by any government agency, not bank guaranteed, subject to risk and may lose value.
Markets & Investing Members of the Raymond James Investment Strategy Committee share their views on...
Markets & Investing Review the latest Weekly Headings by CIO Larry Adam. Key Takeaways ...
Technology & Innovation Learn about a few simple things you can do to protect your personal information...