Drew O’neil discusses fixed income market conditions and offers insight for bond investors.
Sometimes we get so caught up in thinking about where we came from and where we are going, we forget to consider where we are right now. We can learn a lot from analyzing where the market was last month, last year, or 10 years ago. We can do our best to try and forecast where we think the market is going. While these exercises definitely have their merits, sometimes we get too caught up in thinking about the past and the future that we forget about the most important timeframe: the present.
The present is where we are currently investing, it is the current market that we have to deal with. We can daydream about the good ole days when Treasuries were yielding 10% and wish that maybe these yield levels will return in the future, but unfortunately, we cannot go back in time and invest in the past and there is no guarantee for what things will look like in the future. With this in mind, today’s commentary is mostly visual, and meant to provide a few snapshots of the market that exists today which will hopefully provide some insight and motivation on where to invest.
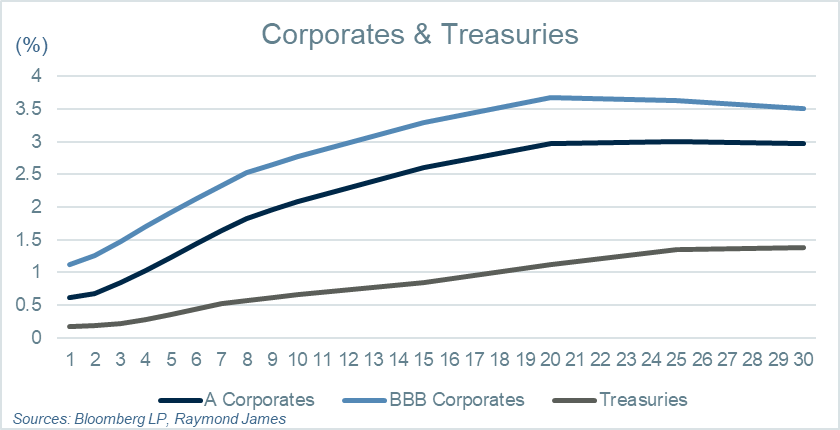
Treasury yields receive most of the attention by the media, as it is the benchmark market for most of the financial world. As the graph shows, the Treasury curve is very flat and relatively low yielding. Many portfolios do not hold Treasuries; therefore, the corporate curves are likely more relevant to the average investor. The corporate market offers investors a decent slope in the intermediate part of the curve while providing significant yield pick-up to Treasuries.
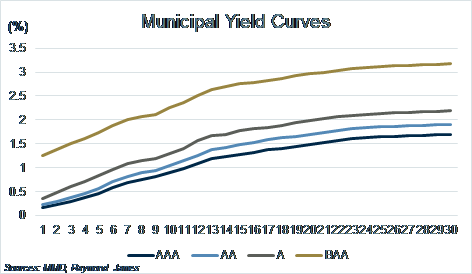
The municipal market is a very high-quality market and solicits high demand in times of economic uncertainty. This graph shows municipal yield curves for the different ratings categories. As would be expected, as ratings decrease, yields increase. This graph shows nominal yields of municipal bonds, but keep in mind the tax benefits that they can provide when considering yield levels.
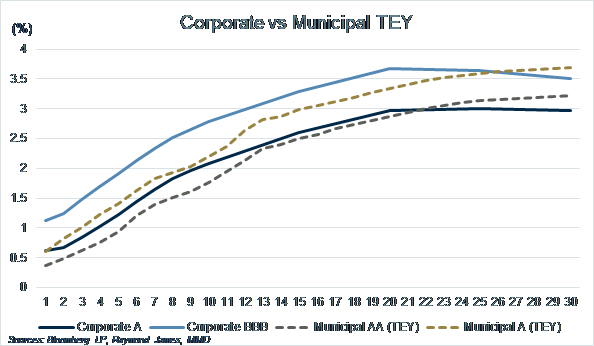
This graph compares corporate yield curves with taxable-equivalent municipal bond yield curves (assuming the highest federal tax bracket of 40.8%). Comparing taxable equivalent yields on municipals to yields in the taxable bond market makes a fairer apples-to-apples comparison, as the tax benefits provided to higher tax bracket investors can be substantial.
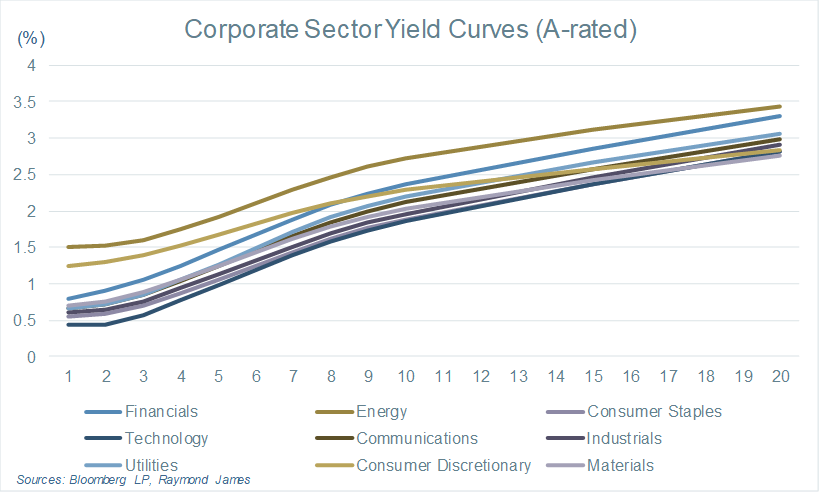
This graph reminds us that not all corporate bonds are created equal. When looking at A-rated corporates, for example, there is a wide range of sectors and companies within each sector to consider, each providing various levels of risk and reward.
To learn more about the risks and rewards of investing in fixed income, please access the Securities Industry and Financial Markets Association’s “Learn More” section of investinginbonds.com, FINRA’s “Smart Bond Investing” section of finra.org, and the Municipal Securities Rulemaking Board’s (MSRB) Electronic Municipal Market Access System (EMMA) “Education Center” section of emma.msrb.org.
The author of this material is a Trader in the Fixed Income Department of Raymond James & Associates (RJA), and is not an Analyst. Any opinions expressed may differ from opinions expressed by other departments of RJA, including our Equity Research Department, and are subject to change without notice. The data and information contained herein was obtained from sources considered to be reliable, but RJA does not guarantee its accuracy and/or completeness. Neither the information nor any opinions expressed constitute a solicitation for the purchase or sale of any security referred to herein. This material may include analysis of sectors, securities and/or derivatives that RJA may have positions, long or short, held proprietarily. RJA or its affiliates may execute transactions which may not be consistent with the report’s conclusions. RJA may also have performed investment banking services for the issuers of such securities. Investors should discuss the risks inherent in bonds with their Raymond James Financial Advisor. Risks include, but are not limited to, changes in interest rates, liquidity, credit quality, volatility, and duration. Past performance is no assurance of future results.
Stocks are appropriate for investors who have a more aggressive investment objective, since they fluctuate in value and involve risks including the possible loss of capital. Dividends will fluctuate and are not guaranteed. Prior to making an investment decision, please consult with your financial advisor about your individual situation.
Markets & Investing Members of the Raymond James Investment Strategy Committee share their views on...
Markets & Investing Review the latest Weekly Headings by CIO Larry Adam. Key Takeaways ...
Technology & Innovation Learn about a few simple things you can do to protect your personal information...