Raymond James CIO Larry Adam discusses why we were due for the recent market volatility.
To read the full article, see the Thoughts on the Market publication linked below.
Downside equity market volatility can be unsettling, but it is important to put the pullback in perspective and identify the drivers of the negative market reaction. First and foremost, the equity market was due for a modest pullback. In fact, historically (dating back to 1980), the S&P 500 experiences an average of three to four pullbacks of 5% or more in a year. Prior to this most recent ~8% decline, the S&P 500 only had one other pullback of 5% or more which occurred during the banking turmoil back in March. In addition, after the S&P 500 notched its best start to a year (through July) since 1997 and rallied well above our year-end target of 4,400, we cautioned investors in our August 4 Weekly Headings to prepare for a potential pullback in equity prices. We highlighted four main reasons for our caution that included elevated expectations for the economy (remember that the Atlanta Fed GDPNow indicator had at one point estimated 3QGDP at 5.9%), optimistic bullish sentiment (remember many Wall Street analysts raised their S&P 500 targets), expensive valuations (the P/E multiple rose to ~20x on a trailing basis), and the negative seasonal patterns (August and September tend to be the weaker months of the year, September in particular has now been in negative territory for each of the last four years)..
It is difficult to time a bottom and downside volatility may continue in the near term. But given that we have had a pullback, the current upside to our year-end target of 4,400 and 12-month target of 4,650 is ~4% and 10% respectively on a total return basis. The reason we remain modestly constructive on the equity market is that none of our forecasts that take us to those levels have changed.
- Economy | We have not changed our call for a mild recession in the first half of 2024—driven by slowing job growth, depleted excess savings and the lagged impact of higher borrowing costs. Importantly, we are already starting to see a moderation in the consumer as September
consumer confidence declined for the second consecutive month and forecasts suggest a weaker holiday shopping season. However, as we expect the second mildest recession in history (both in time and magnitude of the economic contraction), earnings should remain resilient throughout the recession. This should allow the S&P 500 to avoid retesting the October 2022 lows. - Federal Reserve | The Fed is in the late innings of its tightening cycle, with possibly one more rate hike this year before ultimately cutting interest rates in mid-2024. The important point is that, historically, the S&P 500 rallies after the last Fed rate hike.
- Interest Rates | Yes, the 10-year Treasury yield has risen to ~4.60%, but our expectation is that it will not stay there long as we expect longer- term interest rates to fall toward 3.5% over the next 12 months. Recessionary concerns, decelerating inflation and the Fed ending its
tightening cycle should force interest rates lower. This will be significant as higher rates are likely the biggest factor negatively impacting the
P/E multiple of the S&P 500 and causing the recent equity decline; so, if interest rates fall, the P/E multiple should move higher. - Inflation | We expect inflation to continue to trend lower over the next several quarters. Yes, the ‘headline’ inflation trend has risen due to higher energy prices but now that oil prices have reached our year-end target of $85 to $90/barrel, the future impact should be less. We expect
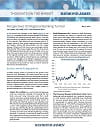
core prices to continue on a disinflationary path even if headline inflation moves higher. A continuation of goods prices falling and shelter/rent prices decelerating should contribute to the downward trend. Reduced inflation should drive interest rates lower and take pressure off the Fed. - Changing Seasonality | The negative seasonality pattern should turn more favorable as we enter the fourth quarter. Historically, mid- October through the end of the year has been strong. In addition, it does appear as if the market in the near term is oversold as market sentiment has moved to more negative levels and the 14-Day RSI declined into oversold territory (a level below 30).
Other than the Fed meeting, the last few weeks have been void of important economic and fundamental data for investors to assess. But that changes over the next several weeks as we get more economic data and earnings season ramps up in mid-October. From an economic perspective, we anticipate the data will confirm an economy that is slowing (not imploding) and that inflation is on a firm downward path. Important catalysts to watch to support our view include PCE (this Friday), ISM on Monday 10/2, JOLTs on 10/3, the employment report on 10/6, PPI on 10/11, and CPI on 10/12. From an earnings perspective, we expect earnings growth to stabilize and grow for the first time in four quarters. The important thing to watch is that companies are likely to beat their earnings on the back of expense management, normalizing supply chains and falling input costs. The point is that we do not expect guidance to suggest a steep decline in earnings moving forward. While we are well below consensus earnings for 2024 ($220 vs $247), our earnings estimate supports our 12-month target of 4,650.
Read the full
Thoughts on the Market
All expressions of opinion reflect the judgment of the author(s) and the Investment Strategy Group, but not necessarily those of Raymond James & Associates, and are subject to change. This information should not be construed as a recommendation. The foregoing content is subject to change at any time without notice. Content provided herein is for informational purposes only. There is no guarantee that these statements, opinions or forecasts provided herein will prove to be correct. Economic and market conditions are subject to change. Investing involves risks including the possible loss of capital. Material is provided for informational purposes only and does not constitute a recommendation. Diversification and asset allocation do not ensure a profit or protect against a loss.
The information has been obtained from sources considered to be reliable, but we do not guarantee that the foregoing material is accurate or complete. Diversification and asset allocation do not ensure a profit or protect against a loss.
INTERNATIONAL INVESTING| International investing involves additional risks such as currency fluctuations, differing financial accounting standards, and possible political and economic instability. These risks are greater in emerging markets.
OIL Investing in oil involves special risks, including the potential adverse effects of state and federal regulation and may not be suitable for all investors.
The Consumer Price Index (CPI) | is a measure of inflation compiled by the US bureau of Labor Studies.
Personal Consumption Expenditure Price Index | The PCE is a measure of the prices that people living in the United States, or those buying on their behalf, pay for goods and services.
DESIGNATIONS
Certified Financial Planner Board of Standards Inc. owns the certification marks CFP® and CERTIFIEDFINANCIALPLANNER™ in the U.S.
Investments & Wealth Institute TM (The Institute) is the owner of the certification marks “CIMA” and “Certified Investment Management Analyst. ”Use of CIMA and/or Certified Investment Management Analyst signifies that the user has successfully completed The Institute’s initial and ongoing credentialing requirements for investment management professionals.
CFA® and Chartered Financial Analyst® are registered trademarks owned by CFA Institute.
FIXED INCOME DEFINITION
AGGREGATE BOND | Bloomberg USAgg Bond Total Return Index: The index is a measure of the investment grade, fixed-rate, taxable bond market of roughly 6,000 SEC-registered securities with intermediate maturities averaging approximately 10 years. The index includes bonds from the Treasury, Government-Related, Corporate, MBS, ABS, and CMBS sectors.
HIGH YIELD | Bloomberg US Corporate High Yield Total Return Index: The index measures the USD-denominated, high yield, fixed-rate corporate bond market. Securities are classified as high yield if the middle rating of Moody’s, Fitch and S&P is Ba1/ BB+/BB+ or below.
S&P 500 | The S&P Total Return Index: The index is widely regarded as the best single gauge of large-cap U.S. equities. There is over USD 7.8 trillion benchmarked to the index, with index assets comprising approximately USD 2.2 trillion of this total. The index includes 500 leading companies and captures approximately 80% coverage of available market capitalization.
KBW REGIONAL BANKING INDEX | The KBW Regional Banking Index is a benchmark stock index for the regional banking sector representing small to medium U.S. national regional banks.
RUSSELL 2000 INDEX |The Russell 2000 Index is a small-cap U.S. stock market index that makes up the smallest 2,000 stocks in the Russell 3000 Index.
NFIB SMALL BUSINESS OPTIMISIM INDEX | A composite of ten seasonally adjusted components, providing an indication of the health of small businesses in the US.
INTERNATIONAL DISCLOSURES FOR CLIENTS IN THE UNITED KINGDOM | For clients of Raymond James Financial International Limited (RJFI): This document and any investment to which this document relates is intended for the sole use of the persons to whom it is addressed, being persons who are Eligible Counter parties or Professional Clients as described in the FCA rules or persons described in Articles 19(5) (Investment professionals) or 49(2) (high net worth companies, unincorporated associations, etc.) of the Financial Services and Markets Act 2000 (Financial Promotion) Order 2005 (as amended)or any other person to whom this promotion may lawfully be directed. It is not intended to be distributed or passed on, directly or indirectly, to any other class of persons and may not be relied upon by such persons and is, therefore, not intended for private individuals or those who would be classified as Retail Clients.
FOR CLIENTS OF RAYMOND JAMES INVESTMENT SERVICES, LTD.: This document is for the use of professional investment advisers and managers and is not intended for use by clients.
FOR CLIENTS IN FRANCE | This document and any investment to which this document relates is intended for the sole use of the persons to whom it is addressed, being persons who are Eligible Counterparties or Professional Clients as described in “Code Monetaire et Financier” and Reglement General de l’Autorite des marches Financiers. It is not intended to be distributed or passed on, directly or indirectly, to any other class of persons and may not be relied upon by such persons and is, therefore, not intended for private individuals or those who would be classified as Retail Clients.
FOR CLIENTS OF RAYMOND JAMES EURO EQUITIES | Raymond James Euro Equities is authorised and regulated by the Autorite de Controle Prudentiel et de Resolution and the Autorite des Marches Financiers.
FOR INSTITUTIONAL CLIENTS IN THE EUROPEAN ECONOMIC AREA (EE) OUTSIDE OF THE UNITED KINGDOM | This document (and any attachments or exhibits hereto) is intended only for EEA institutional clients or others to whom it may lawfully be submitted.
FOR CANADIAN CLIENTS | This document is not prepared subject to Canadian disclosure requirements, unless a Canadian has contributed to the content of the document. In the case where there is Canadian contribution, the document meets all applicable IIROC disclosure requirements.
Source: FactSet, as of 9/26/2023
INTERNATIONALHEADQUARTERS:THERAYMONDJAMESFINANCIALCENTER 880 CARILLONPARKWAY// ST. PETERSBURG, FL 33716 // 800.248.8863 RAYMONDJAMES.COM
© 2023 Raymond James & Associates, Inc., member New York Stock Exchange/SIPC. © 2023 Raymond James Financial Services, Inc., member FINRA/SIPC. Investment products are: not deposits, not FDIC/NCUA insured, not insured by any government agency, not bank guaranteed, subject to risk and may lose value.
Markets & Investing Members of the Raymond James Investment Strategy Committee share their views on...
Markets & Investing Review the latest Weekly Headings by CIO Larry Adam. Key Takeaways ...
Technology & Innovation Learn about a few simple things you can do to protect your personal information...