Chief Economist Scott Brown discusses the latest market data.
There were no major surprises from the Fed policy meeting. Bond yields moved higher, but the mood among stock market participants seemed to brighten relative to the previous week.
The Federal Open Market Committee (FOMC) left short-term interest rates unchanged (federal funds target range of 0.00%-0.25%) and did not alter the monthly pace of asset purchases ($120 billion per month). In its policy statement, the FOMC indicated that “if progress continues broadly as expected, the Committee judges that a moderation in the pace of asset purchases may soon be warranted.” In his press conference, Chair Powell suggested that the goal of “substantial further progress” in labor market conditions would likely be met in the October Employment Report, which would lead to a taper announcement at the November 2-3 policy meeting. While an increase in short-term interest is still a long way off, Fed officials generally brought forward their expectations for liftoff. (Officials were evenly split on whether that would start in 2022.)
Reflecting the delta surge and the impact of the semiconductor shortage on motor vehicle production, officials’ median forecast of 2021 GDP growth was lowered to 5.9% (from 7.0% in June and 6.5% in March), while the 2022 outlook was raised from 3.3% to 3.8%. The median forecast for the PCE Price Index rose to 4.2% (vs. 3.4% in June and 2.4% in March), but officials expect inflation to fall back to 2.2% in 2022 and 2023.
Next week: The economic data reports are unlikely to be market-moving but will help to fill in the near-term economic picture.
Indices
| Last | Last Week | YTD return % | |
|---|---|---|---|
| DJIA | 34,764.82 | 34,751.32 | 13.59%% |
| NASDAQ | 15,052.25 | 15,181.93 | 16.79%% |
| S&P 500 | 4,448.98 | 4,473.75 | 18.45%% |
| MSCI EAFE | 2,353.16 | 2,366.06 | 9.58% |
| Russell 2000 | 2259.04 | 2,232.91 | 14.39% |
Consumer Money Rates
| Last | 1 year ago | |
|---|---|---|
| Prime Rate | 3.25 | 3.25 |
| Fed Funds | 0.07 | 0.08 |
| 30-year mortgage | 3.1 | 3.02 |
Currencies
| Last | 1 year ago | |
|---|---|---|
| Dollars per British Pound | 1.3667 | 1.275 |
| Dollars per Euro | 1.1711 | 1.167 |
| Japanese Yen per Dollar | 129.46 | 105.41 |
| Canadian Dollars per Dollar | 1.272 | 1.336 |
| Mexican Peso per Dollar | 20.167 | 22.153 |
Commodities
| Last | 1 year ago | |
|---|---|---|
| Crude Oil | 73.14 | 40.31 |
| Gold | 1745.40 | 1866.30 |
Bond Rates
| Last | 1 month ago | |
|---|---|---|
| 2-year treasury | 0.26 | 0.24 |
| 10-year treasury | 1.42 | 1.34 |
| 10-year municipal (TEY) | 1.51 | 1.45 |
Treasury Yield Curve – 09/24/2021
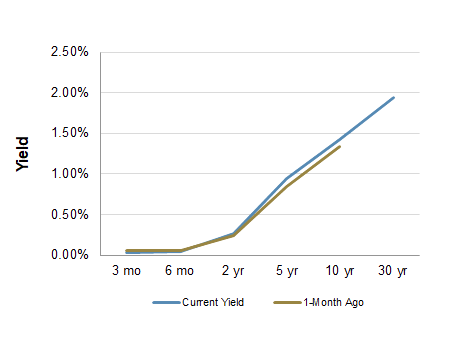
As of close of business 09/23/2021
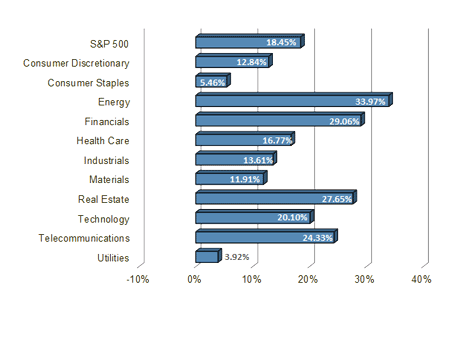
S&P Sector Performance (YTD) – 09/24/2021
Economic Calendar
| September 27 | — | Durable Goods Orders (August) |
| September 28 | — | CB Consumer Confidence Index (September) |
| — | Powell Testimony (CARES Act) | |
| September 29 | — | Pending Home Sales Index (August) |
| — | Powell Panel Discussion | |
| September 30 | — | Jobless Claims (week ending September 25) |
| — | Real GDP (2Q21, 3rd estimate) | |
| — | Chicago Business Barometer (September) | |
| October 1 | — | Personal Income and Spending (August) |
| — | ISM Manufacturing Index (September) | |
| — | UM Consumer Sentiment (September) | |
| October 8 | — | Employment Report (September) |
| October 11 | — | Columbus Day/Indigenous Peoples Day (bond market closed) |
| October 13 | — | Consumer Price Index (September) |
| October 15 | — | Retail Sales (September) |
| November 3 | — | FOMC Policy Decision |
All expressions of opinion reflect the judgment of the author and are subject to change. There is no assurance any of the forecasts mentioned will occur or that any trends mentioned will continue in the future. Investing involves risks including the possible loss of capital. Past performance is not a guarantee of future results. International investing is subject to additional risks such as currency fluctuations, different financial accounting standards by country, and possible political and economic risks, which may be greater in emerging markets. While interest on municipal bonds is generally exempt from federal income tax, it may be subject to the federal alternative minimum tax, and state or local taxes. In addition, certain municipal bonds (such as Build America Bonds) are issued without a federal tax exemption, which subjects the related interest income to federal income tax. Municipal bonds may be subject to capital gains taxes if sold or redeemed at a profit. Taxable Equivalent Yield (TEY) assumes a 35% tax rate.
The Dow Jones Industrial Average is an unmanaged index of 30 widely held stocks. The NASDAQ Composite Index is an unmanaged index of all common stocks listed on the NASDAQ National Stock Market. The S&P 500 is an unmanaged index of 500 widely held stocks. The MSCI EAFE (Europe, Australia, Far East) index is an unmanaged index that is generally considered representative of the international stock market. The Russell 2000 index is an unmanaged index of small cap securities which generally involve greater risks. An investment cannot be made directly in these indexes. The performance noted does not include fees or charges, which would reduce an investor’s returns. U.S. government bonds and treasury bills are guaranteed by the US government and, if held to maturity, offer a fixed rate of return and guaranteed principal value. U.S. government bonds are issued and guaranteed as to the timely payment of principal and interest by the federal government. Treasury bills are certificates reflecting short-term (less than one year) obligations of the U.S. government.
Commodities trading is generally considered speculative because of the significant potential for investment loss. Markets for commodities are likely to be volatile and there may be sharp price fluctuations even during periods when prices overall are rising. Specific sector investing can be subject to different and greater risks than more diversified investments. Gross Domestic Product (GDP) is the annual total market value of all final goods and services produced domestically by the U.S. The federal funds rate (“Fed Funds”) is the interest rate at which banks and credit unions lend reserve balances to other depository institutions overnight. The prime rate is the underlying index for most credit cards, home equity loans and lines of credit, auto loans, and personal loans. Material prepared by Raymond James for use by financial advisors. Data source: Bloomberg, as of close of business September 23, 2021.
Markets & Investing Members of the Raymond James Investment Strategy Committee share their views on...
Markets & Investing Review the latest Weekly Headings by CIO Larry Adam. Key Takeaways ...
Technology & Innovation Learn about a few simple things you can do to protect your personal information...