Chief Economist Eugenio J. Alemán discusses current economic conditions.
The current Federal Reserve’s (Fed’s) tightening cycle is approaching an end. This has been one of the most forceful as well as the fastest tightening cycle in history. However, because the federal funds rate was well below the neutral federal funds rate, the time it has been above that neutral level has not been that long. Furthermore, it is highly doubtful that the “neutral” federal funds rate has remained at the rate it was before the COVID-19 pandemic recession, which many estimated it to be 2.5%. That is, the current neutral federal funds rate is probably higher than the 2.5% rate estimated before the pandemic recession.
The reason for this is inflation. Before the COVID-19 pandemic, the rate of inflation was, for the most part, below the 2% average targeted by the Fed. However, because inflation has been running above the Fed’s 2% target for two years, it is clear that the neutral rate today is above the 2.5% estimated before the pandemic recession. This means that the federal funds rate has been above the current neutral rate for even less time than if it had stayed at 2.5% during this cycle.
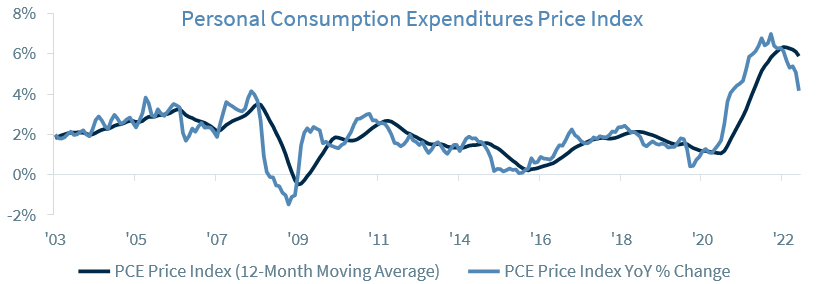
Going forward, however, our expectation is for the neutral federal funds rate to come back to about 2.5% as the Fed continues to target a 2.0% inflation rate for the PCE price index. However, we have heard increased speculation that the Fed may change the inflation target rate “because it will be very difficult to hit 2.0% after what has happened over the last several years,” or something on those lines.
We disagree that this is the case for several reasons. First, you do not change the flag post in the middle of the competition. That is, there is a zero probability that the Fed will change the target rate of inflation… because there are analysts saying that the Fed cannot achieve the current target rate of inflation. The target rate of inflation is a target. That is, the Fed is going to conduct monetary policy to bring the rate of inflation to the target rate, period, independently of what any analyst believes or not whether the target needs to be at 2% or any other number different from 2%. Second, before the COVID-19 pandemic recession, a 3.5% unemployment rate was consistent with a 2% inflation target. However, this may not be true today and monetary policy may have to be adjusted in order to allow for a higher rate of unemployment in order to achieve the target rate of inflation of 2%. Third, if after achieving a 2% inflation over several years, the Fed decides that something different than a 2% for the average inflation rate over the years is better than the current rate target, then they may decide to change it. But this decision will be completely independent from one that says that they cannot attain the 2% target. That is, they will change the target if they believe that a different target is better for the economy than the target they have today, not because they cannot achieve that target.
Consumers dried up inventories
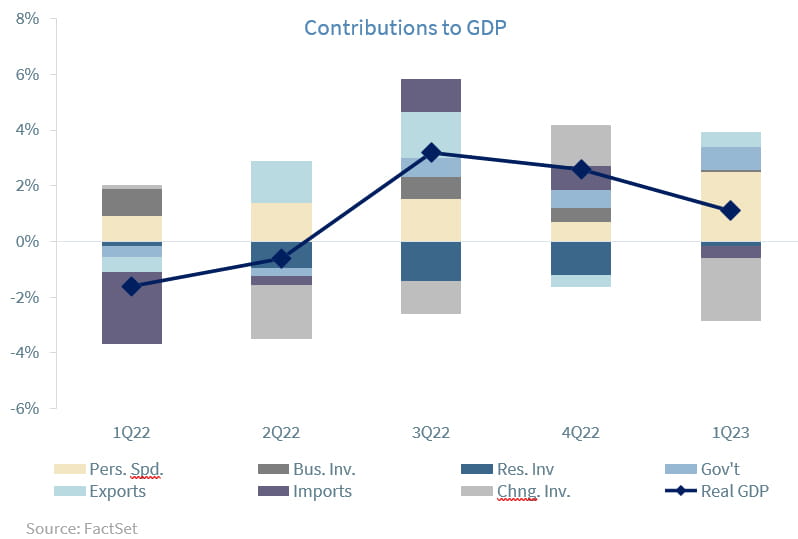
The U.S. economy grew by 1.1% during the first quarter of the year, driven by the resiliency and strength of the consumer. In fact, consumer spending makes up ~70% of the economy and it grew at the fastest pace in almost two years. After four consecutive quarters of declines, goods spending increased significantly as consumers switched their spending to more durable goods, especially motor vehicles and parts. Similarly, spending on services continued to increase led by recreational services, health care, and food services and accommodations.
On the other hand, elevated interest rates continued to be a headwind for those sectors of the economy that are more interest-rate sensitive, which resulted in weak housing and business investments. However, the effects over residential investment were relatively mild during the first quarter of the year as mortgage rates came down somewhat during the period. Thus, residential investment wasn’t a big drag on growth during the first quarter of the year. Inventories were the largest contributor to the weakness in GDP in the first quarter, subtracting 2.26 percentage points from the headline number. Inventories are known to be a volatile component of GDP, and as companies prepare for a further economic slowdown, it can be expected that they wouldn’t rush to replenish shelves. However, similarly to what happened in 2021, inventories could become a positive contributor when businesses start rebuilding them in the future.
Monetary policy tends to act with a lag, and historically it takes about 12 months for an economy to fully digest its impact. Furthermore, as we argued in the first section of this weekly, interest rates have been binding for less time than that. However, it seems clear that if interest rates do not go up meaningfully, the housing markets has already experienced the worse for this tightening cycle. Going forward, we expect the Federal Reserve’s 500 bps of hikes over the last year to continue to impact the economy over time, ultimately bringing it to a mild recession starting in the third quarter and lasting for two quarters. Despite the slowdown, we expect the U.S. economy to grow at 1% in 2023.
Economic and market conditions are subject to change.
Opinions are those of Investment Strategy and not necessarily those of Raymond James and are subject to change without notice. The information has been obtained from sources considered to be reliable, but we do not guarantee that the foregoing material is accurate or complete. There is no assurance any of the trends mentioned will continue or forecasts will occur. Last performance may not be indicative of future results.
Consumer Price Index is a measure of inflation compiled by the U.S. Bureau of Labor Statistics. Currencies investing is generally considered speculative because of the significant potential for investment loss. Their markets are likely to be volatile and there may be sharp price fluctuations even during periods when prices overall are rising.
Consumer Sentiment is a consumer confidence index published monthly by the University of Michigan. The index is normalized to have a value of 100 in the first quarter of 1966. Each month at least 500 telephone interviews are conducted of a contiguous United States sample.
Personal Consumption Expenditures Price Index (PCE): The PCE is a measure of the prices that people living in the United States, or those buying on their behalf, pay for goods and services. The change in the PCE price index is known for capturing inflation (or deflation) across a wide range of consumer expenses and reflecting changes in consumer behavior.
The Consumer Confidence Index (CCI) is a survey, administered by The Conference Board, that measures how optimistic or pessimistic consumers are regarding their expected financial situation. A value above 100 signals a boost in the consumers’ confidence towards the future economic situation, as a consequence of which they are less prone to save, and more inclined to consume. The opposite applies to values under 100.
Leading Economic Index: The Conference Board Leading Economic Index is an American economic leading indicator intended to forecast future economic activity. It is calculated by The Conference Board, a non- governmental organization, which determines the value of the index from the values of ten key variables
Certified Financial Planner Board of Standards Inc. owns the certification marks CFP®, Certified Financial Planner™, CFP® (with plaque design) and CFP® (with flame design) in the U.S., which it awards to individuals who successfully complete CFP Board’s initial and ongoing certification requirements.
Links are being provided for information purposes only. Raymond James is not affiliated with and does not endorse, authorize or sponsor any of the listed websites or their respective sponsors. Raymond James is not responsible for the content of any website or the collection or use of information regarding any website’s users and/or members.
GDP Price Index: A measure of inflation in the prices of goods and services produced in the United States. The gross domestic product price index includes the prices of U.S. goods and services exported to other countries. The prices that Americans pay for imports aren’t part of this index.
FHFA House Price Index: The FHFA House Price Index is the nation’s only collection of public, freely available house price indexes that measure changes in single-family home values based on data from all 50 states and over 400 American cities that extend back to the mid-1970s.
Expectations Index: The Expectations Index is a component of the Consumer Confidence Index® (CCI), which is published each month by the Conference Board. The CCI reflects consumers’ short-term—that is, six- month—outlook for, and sentiment about, the performance of the overall economy as it affects them.
Present Situation Index: The Present Situation Index is an indicator of consumer sentiment about current business and job market conditions. Combined with the Expectations Index, the Present Situation Index makes up the monthly Consumer Confidence Index.
Pending Home Sales Index: The Pending Home Sales Index (PHS), a leading indicator of housing activity, measures housing contract activity, and is based on signed real estate contracts for existing single-family homes, condos, and co-ops. Because a home goes under contract a month or two before it is sold, the Pending Home Sales Index generally leads Existing-Home Sales by a month or two.
DISCLOSURES
Import Price Index: The import price index measure price changes in goods or services purchased from abroad by
U.S. residents (imports) and sold to foreign buyers (exports). The indexes are updated once a month by the Bureau of Labor Statistics (BLS) International Price Program (IPP).
ISM New Orders Index: ISM New Order Index shows the number of new orders from customers of manufacturing firms reported by survey respondents compared to the previous month.ISM Employment Index: The ISM Manufacturing Employment Index is a component of the Manufacturing Purchasing Managers Index and reflects employment changes from industrial companies.
ISM Inventories Index: The ISM manufacturing index is a composite index that gives equal weighting to new orders, production, employment, supplier deliveries, and inventories.
ISM Production Index: The ISM manufacturing index or PMI measures the change in production levels across the
U.S. economy from month to month.
ISM Services PMI Index: The Institute of Supply Management (ISM) Non-Manufacturing Purchasing Managers’ Index (PMI) (also known as the ISM Services PMI) report on Business, a composite index is calculated as an indicator of the overall economic condition for the non-manufacturing sector.
Source: FactSet, data as of 12/29/2022
Markets & Investing April 01, 2024 Doug Drabik discusses fixed income market conditions and offers...
Markets & Investing April 01, 2024 Market rally driven by a broadening of the market and optimism that...
Markets & Investing April 01, 2024 Raymond James CIO Larry Adam reminds investors they need to be well...