Chief Economist Scott Brown discusses current economic conditions.
The August Employment Report in Perspective
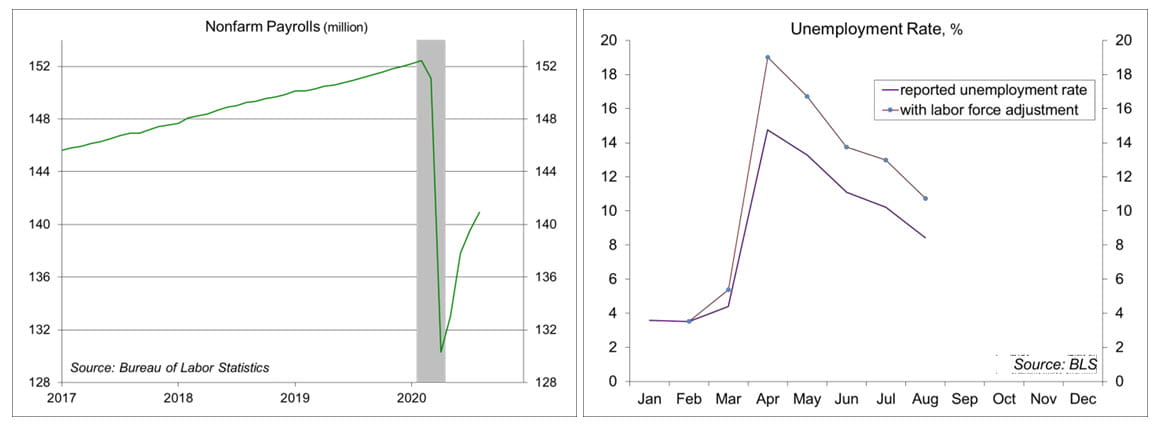
Private–sector payrolls rose by 1.027 million in the initial estimate for August. Normally, such a gain would be considered outstanding. However, in this recovery, that comes as a disappointment. The increase in jobs leaves us well short of where we were before the pandemic, and the pace of improvement appears to have slowed. In contrast to the establishment survey, the household survey showed significant improvement in August. However, the payroll data should be granted more weight.
The government added 251,000 temporary census workers in August, as expected, boosting the overall gain in nonfarm payrolls (+1.371 million). These jobs will be lost later. State and local government added 93,000, less than a third of that in education. Seasonal hiring in education will be more significant in September, and it remains unclear what effect the pandemic will have on the totals.
In the last four months, private-sector payrolls have recovered about half of the jobs lost in March and April. The major cyclical sectors (construction, manufacturing, retail) have done better, but are still not back to where they were. The job recoveries in transportation services, accommodations, entertainment, and restaurants have been slower going. Motion picture and sound recording payrolls are half of what they were in February. Payrolls in performing arts and spectator sports remain down 46%. Restaurants and bars have added 3.6 million jobs since April, but were down 6.1 million between February and April. A full recovery in these badly hit sectors isn’t going to occur until the pandemic is well behinds us, which won’t be anytime soon.
The unemployment rate surprised to the downside in August, falling to 8.4% (from 10.2%). The rate was expected to fall in August due to a decrease in labor force participation following the expiration of enhanced benefits at the end of July. Instead, the labor force increased by 968,000, while employment rose by more than 3.7 million. Hold on a second. Anyone familiar with the household survey knows that estimates of levels are unreliable. The household survey is based on only 60,000 households. A survey that small won’t yield accurate estimated of the labor force and employment, but it does give reasonable estimates of ratios, such as labor force participation and the unemployment rate.
Still, how does one explain August’s sharp drop in the unemployment rate, especially in combination with the more moderate gain in nonfarm payrolls? That’s unclear. However, it’s important to note that the reported unemployment rate understates the degree of labor market weakness in tough times. Over eight million people exited the labor force in March and April. To be counted as unemployed, one has to be actively looking for a job. Hence, those exiting are not classified as “unemployed.” To correct for this, one could simply look at the employment population ratio (56.5% in August, vs. 55.1% in July, 51.3% in April, and 61.1% in February. Alternative, one could extrapolate the pre-pandemic trend in the labor force (about +0.5% per year) – doing this would generate a 10.7% unemployment rate in August (compared to the reported 8.4%), down from 13.0% in July and 19.0% in April (and 3.5% in February). Even with this adjustment, the rate fell sharply in August. Sometimes, the household survey and the establishment survey are just going to differ, but the payroll figure should get the most weight.
The job outlook is important because jobs drive consumer spending, which accounts for 70% for Gross Domestic Product. The sectors exhibiting prolonged weakness in jobs are generally lower-paying industries, but for the households experiencing job losses, the consequences are dire. Many of these jobs are not expected to come back. The reallocation of workers over time is a difficult and painful process. Two hundred years ago, most jobs were in agriculture. After World War II, about a third of jobs were in manufacturing. It’s unclear what lies ahead, but the great success of the U.S. economy has long been its ability to reinvent itself.
Recent Economic Data
The Fed’s Beige Book noted increased economic activity, “but gains were generally modest and activity remained well below levels prior to the pandemic.” Continued uncertainty and volatility related to the pandemic, and its negative effect on consumer and business activity, “was a theme echoed across the country.”
The ISM Manufacturing Index rose to 56.0 in August, vs. 54.2 in July, reflecting stronger growth in new orders and production. The ISM Services Index (formerly known as the Non-Manufacturing Index) edged down to
56.9 in August (from 58.1 in July). Business activity and new orders continued to advance, but slower than in July. Both surveys showed price pressures from supply chain disruptions and weakness in jobs.
The U.S. merchandise trade deficit widened to $80.9 billion in July, a record. The surplus in services fell to
Nonfarm payrolls rose by 1.371 million in August, about as expected, boosted partly by a 251,000 increase in temporary hiring for the census. Payrolls are still down 11.5 million (7.6%) from February. The unemployment rate fell to 8.4% (from 10.2%), even as labor force participation improved. That’s good news. However, because many laid off workers exited the labor force earlier in the pandemic, the unemployment rate understates the weakness in labor market conditions (if labor force growth had remained on its pre-pandemic trend, the unemployment rate would be reported at 10.7% (down from 13.0% in July and 19.0% in April).
$17.4 billion, vs. $22.8 billion in February. Exports fell more than imports in the early part of the pandemic, but imports have risen more than exports in the initial rebound.
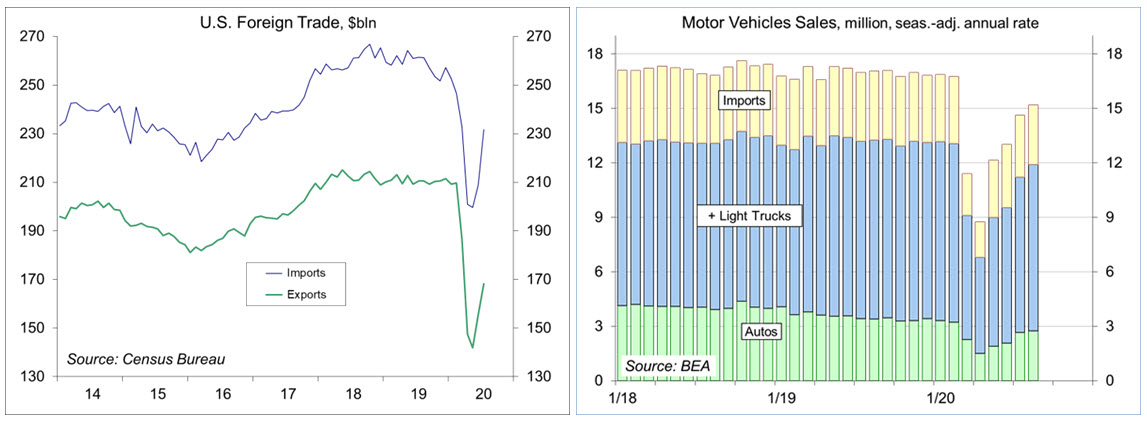
Motor vehicle sales rose to a 15.2 million seasonally adjusted annual rate in August, vs. 17.1 million a year ago.
Gauging the Recovery
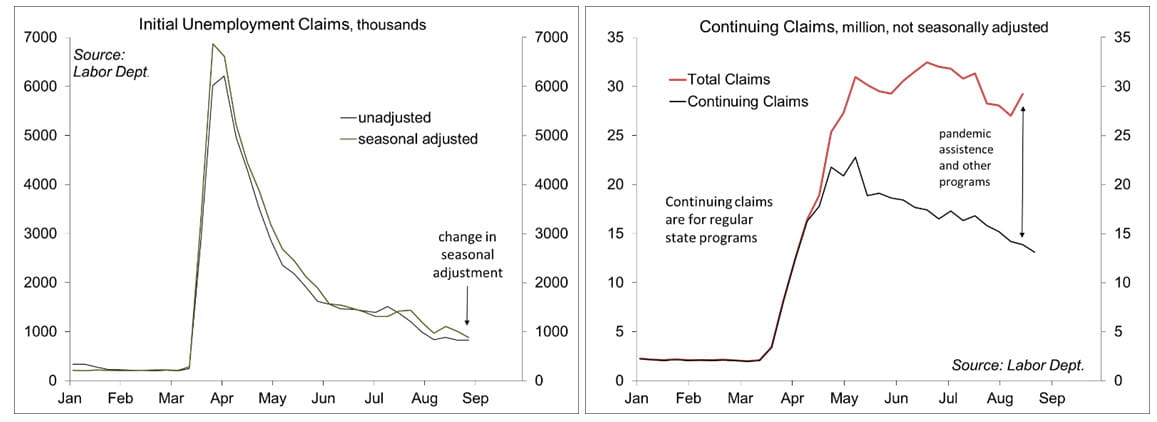
Jobless claims totaled 881,000 in the week ending August 29, as the Labor Department shifted to an additive seasonal adjustment (making the adjusted figure incomparable to previous data). At 833,352, unadjusted claims remain extremely high by historical standards (although less horrific than in March and April). Continuing claims (for regular state unemployment insurance programs) fell by 1,238,000 (week ending August 22) to 13.254 million. However, total persons claiming UI benefits (all programs) rose fell by 2,196,000 in the week ending August 15 to 29.224 million (not seasonally adjusted).
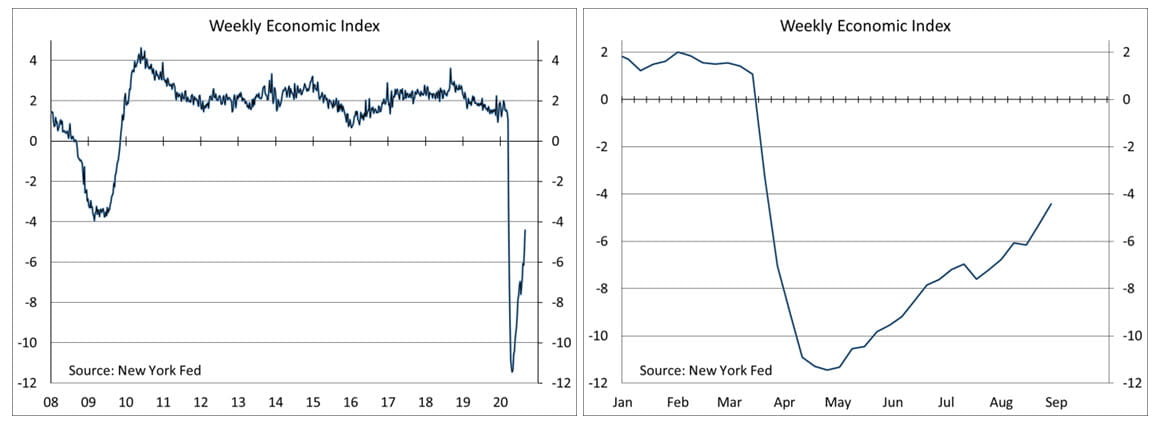
The New York Fed’s Weekly Economic Index rose to -4.41% for the week of August 29, up from -5.31% in the previous week and a low of -11.45% at the end of April. The WEI is scaled to four-quarter GDP growth (for example, if the WEI reads -2% and the current level of the WEI persists for an entire quarter, we would expect, on average, GDP that quarter to be 2% lower than a year previously).
The University of Michigan’s Consumer Sentiment Index edged up to 74.1 in the full-month assessment for August (the survey covered July 29 to August 24), vs. 72.8 at mid-month and 72.5 in July. The report noted that “half of all consumers anticipated the economy would improve in the year ahead, but 62% judged that the overall conditions in the economy could be best described as unfavorable.”
The opinions offered by Dr. Brown should be considered a part of your overall decision-making process. For more information about this report – to discuss how this outlook may affect your personal situation and/or to learn how this insight may be incorporated into your investment strategy – please contact your financial advisor or use the convenient Office Locator to find our office(s) nearest you today.
All expressions of opinion reflect the judgment of the Research Department of Raymond James & Associates (RJA) at this date and are subject to change. Information has been obtained from sources considered reliable, but we do not guarantee that the foregoing report is accurate or complete. Other departments of RJA may have information which is not available to the Research Department about companies mentioned in this report. RJA or its affiliates may execute transactions in the securities mentioned in this report which may not be consistent with the report’s conclusions. RJA may perform investment banking or other services for, or solicit investment banking business from, any company mentioned in this report. For institutional clients of the European Economic Area (EEA): This document (and any attachments or exhibits hereto) is intended only for EEA Institutional Clients or others to whom it may lawfully be submitted. There is no assurance that any of the trends mentioned will continue in the future. Past performance is not indicative of future results.
Markets & Investing Members of the Raymond James Investment Strategy Committee share their views on...
Markets & Investing Review the latest Weekly Headings by CIO Larry Adam. Key Takeaways ...
Technology & Innovation Learn about a few simple things you can do to protect your personal information...