Chief Economist Eugenio J. Alemán discusses current economic conditions.
The strength in consumer demand has been one of the defining characteristics of a very resilient U.S. economy and September’s retail and food services sales report confirmed that the U.S. consumer is alive and well. Recent upward revisions to excess savings accumulated during the COVID-19 pandemic, especially in higher-income households, help partially explain how consumers have kept on consuming. The other partial explanation continues to be the strength of the U.S. labor market, which continues to provide the impetus for the U.S. consumer to remain engaged in the economy even if it requires going further into debt.
One of our arguments for the strength of the U.S. consumer over the last several years has been the improvement in households’ financial conditions as seen by analyzing households’ debt services ratios compared to previous historical periods, especially as the US economy has approached a recessionary environment. That is, the fact that the recovery from the COVID-19 pandemic was not a typical monetary cycle, a cycle characterized by strong borrowing by consumers, is probably at the root of the still strong performance as well as the inability of higher rates to bring the economy to its knees.
What the U.S. economy experienced during and after the COVID-19 pandemic was a typical fiscal cycle, one characterized by large transfers of income from the federal government to individuals and firms. This, together with several decades of very low interest rates, has proved to be an antidote against higher interest rates and has dealt a blow to the ability of the Federal Reserve (Fed) to slow economic activity as well as to the ability of forecasters to correctly gauge the effects of higher interest rates.
Americans are sitting pretty, if not feeling pretty
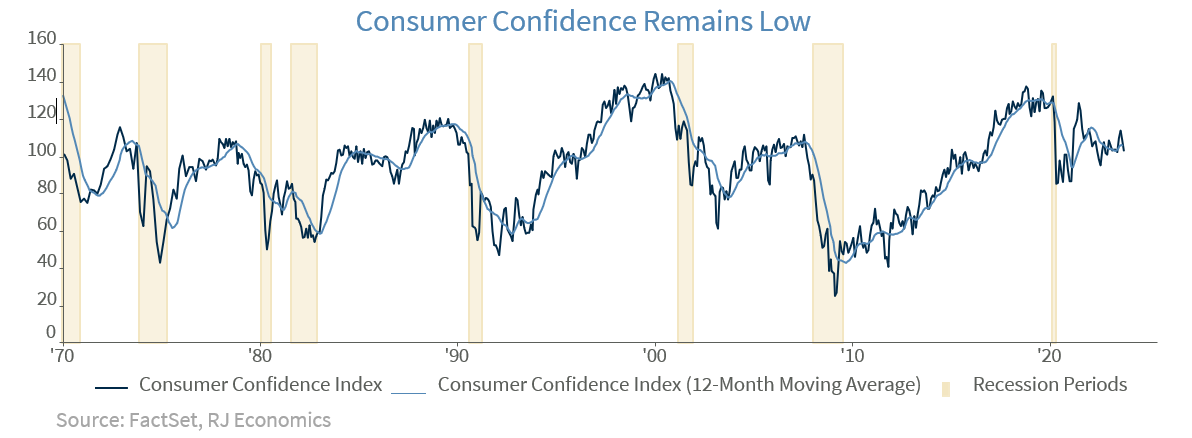
Although consumer confidence and sentiment in the U.S. has remained low even as the economy has continued to grow and the rate of unemployment has remained close to historic lows – which means that everybody who wants a job has a job – the Fed reported that American’s real net worth, that is, the total value of a person’s assets minus what they owe, or their liabilities, increased by an impressive 37% during the period 2019 and 2022.1 And, just in case, and to be clear, inflation did not contribute to this increase in net worth because this was measured in real terms, that is, adjusting for inflation. According to the report, this was the largest three-year increase in the history of the modern Survey of Consumer Finances.
Real median family income increased slightly, by 3%, while real mean income increased by 15% during the period. Although the report noted that the increase in real incomes was broad-based across different income levels, the top income levels gained a larger advantage compared to the lower income levels, contributing to further inequality in the distribution of income. The report also indicated that while incomes were higher across different groupings, i.e., economic as well as demographic characteristics, there was only one exception: educational levels. According to the report, increases in both median as well as mean income were “concentrated among families in which the reference person had a college degree.”
For those families that owned a home, 66.1% of families, according to the homeownership rate, the “median net housing value (the value of a home minus home-secured debt) rose from $139,100 in 2019 to
$201,000 in 2022.” That meant that the median net housing value increased by 44.5% between 2022 and 2019 and underscores the importance of owning a home during this period of time for American homeowners. This was the consequence of an increase in the value of homes at the same time that housing debt remained relatively stable. The flip side of this process was that housing affordability dropped to historic lows, “as the median home was worth more than 4.6 times the median family income.” This tends to indicate that the strength of U.S. home prices at a time of very low supply of homes and low fixed mortgage rates has produced a strong increase U.S. households net worth. Thus, even if real median family income growth increased only 3% during the period, assets, but fundamentally housing assets delivered almost all of the increase in real net worth.
Measures of financial fragility or financial vulnerability declined between 2019 and 2022. The median leverage ratio declined to a 20-year low of 29.2% while the median payment-to-income ratio declined to the lowest level in the survey’s history, to 13.4%.
So, even if Americans still don’t feel very pretty, they do seem to sit pretty.
Economic and market conditions are subject to change.
Opinions are those of Investment Strategy and not necessarily those of Raymond James and are subject to change without notice. The information has been obtained from sources considered to be reliable, but we do not guarantee that the foregoing material is accurate or complete. There is no assurance any of the trends mentioned will continue or forecasts will occur. Last performance may not be indicative of future results.
Consumer Price Index is a measure of inflation compiled by the US Bureau of Labor Statistics. Currencies investing is generally considered speculative because of the significant potential for investment loss. Their markets are likely to be volatile and there may be sharp price fluctuations even during periods when prices overall are rising.
Consumer Sentiment is a consumer confidence index published monthly by the University of Michigan. The index is normalized to have a value of 100 in the first quarter of 1966. Each month at least 500 telephone interviews are conducted of a contiguous United States sample.
Personal Consumption Expenditures Price Index (PCE): The PCE is a measure of the prices that people living in the United States, or those buying on their behalf, pay for goods and services. The change in the PCE price index is known for capturing inflation (or deflation) across a wide range of consumer expenses and reflecting changes in consumer behavior.
The Consumer Confidence Index (CCI) is a survey, administered by The Conference Board, that measures how optimistic or pessimistic consumers are regarding their expected financial situation. A value above 100 signals a boost in the consumers’ confidence towards the future economic situation, as a consequence of which they are less prone to save, and more inclined to consume. The opposite applies to values under 100.
Certified Financial Planner Board of Standards Inc. owns the certification marks CFP®, CERTIFIED FINANCIAL PLANNER™, CFP® (with plaque design) and CFP® (with flame design) in the U.S., which it awards to individuals who successfully complete CFP Board’s initial and ongoing certification requirements.
Links are being provided for information purposes only. Raymond James is not affiliated with and does not endorse, authorize or sponsor any of the listed websites or their respective sponsors. Raymond James is not responsible for the content of any website or the collection or use of information regarding any website’s users and/or members.
GDP Price Index: A measure of inflation in the prices of goods and services produced in the United States. The gross domestic product price index includes the prices of U.S. goods and services exported to other countries. The prices that Americans pay for imports aren’t part of this index.
The Conference Board Leading Economic Index: Intended to forecast future economic activity, it is calculated from the values of ten key variables.
The Conference Board Coincident Economic Index: An index published by the Conference Board that provides a broad-based measurement of current economic conditions.
The Conference Board lagging Economic Index: an index published monthly by the Conference Board, used to confirm and assess the direction of the economy’s movements over recent months.
The U.S. Dollar Index is an index of the value of the United States dollar relative to a basket of foreign currencies, often referred to as a basket of U.S. trade partners’ currencies. The Index goes up when the U.S. dollar gains “strength” when compared to other currencies.
The FHFA House Price Index (FHFA HPI®) is a comprehensive collection of public, freely available house price indexes that measure changes in single-family home values based on data from all 50 states and over 400 American cities that extend back to the mid-1970s.
Import Price Index: The import price index measure price changes in goods or services purchased from abroad by U.S. residents (imports) and sold to foreign buyers (exports). The indexes are updated once a month by the Bureau of Labor Statistics (BLS) International Price Program (IPP).
ISM New Orders Index: ISM New Order Index shows the number of new orders from customers of manufacturing firms reported by survey respondents compared to the previous month. ISM Employment Index: The ISM Manufacturing Employment Index is a component of the Manufacturing Purchasing Managers Index and reflects employment changes from industrial companies.
ISM Inventories Index: The ISM manufacturing index is a composite index that gives equal weighting to new orders, production, employment, supplier deliveries, and inventories.
ISM Production Index: The ISM manufacturing index or PMI measures the change in production levels across the U.S. economy from month to month.
ISM Services PMI Index: The Institute of Supply Management (ISM) Non-Manufacturing Purchasing Managers’ Index (PMI) (also known as the ISM Services PMI) report on Business, a composite index is calculated as an indicator of the overall economic condition for the non-manufacturing sector.
Consumer Price Index (CPI) A consumer price index is a price index, the price of a weighted average market basket of consumer goods and services purchased by households. Changes in measured CPI track changes in prices over time.
Producer Price Index: A producer price index (PPI) is a price index that measures the average changes in prices received by domestic producers for their output.
Industrial production: Industrial production is a measure of output of the industrial sector of the economy. The industrial sector includes manufacturing, mining, and utilities. Although these sectors contribute only a small portion of gross domestic product, they are highly sensitive to interest rates and consumer demand.
The NAHB/Wells Fargo Housing Opportunity Index (HOI) for a given area is defined as the share of homes sold in that area that would have been affordable to a family earning the local median income, based on standard mortgage underwriting criteria.
The S&P CoreLogic Case-Shiller U.S. National Home Price NSA Index measures the change in the value of the U.S. residential housing market by tracking the purchase prices of single-family homes.
The S&P CoreLogic Case-Shiller 20-City Composite Home Price NSA Index seeks to measures the value of residential real estate in 20 major U.S. metropolitan.
Source: FactSet, data as of 7/7/2023
Markets & Investing April 01, 2024 Market rally driven by a broadening of the market and optimism that...
Markets & Investing April 01, 2024 Doug Drabik discusses fixed income market conditions and offers...
Markets & Investing April 01, 2024 Raymond James CIO Larry Adam reminds investors they need to be well...