Raymond James Chief Economist Scott Brown explains why the current economic environment shouldn’t be compared to that of the 1970s and early 1980s.
To read the full article, see the Investment Strategy Quarterly publication linked below.
For a variety of reasons, investors are worried about higher inflation. Some may remember the Great Inflation of the 1970s and early 1980s. Some fret over the sharp rise in commodity prices; others are concerned about the end result of aggressive monetary and fiscal policy. However, while we may see reflation – a pickup in prices that were restrained due to the pandemic – a lasting period of substantially higher inflation appears unlikely.
Measures of inflation
The Consumer Price Index (CPI) measures the cost of a basket of goods and services over time. The basket represents what a typical consumer would purchase, and will change periodically as new products and services are introduced.
The Personal Consumption Expenditures Price Index (PCE Price Index), the Federal Reserve’s chief inflation gauge, is similar to the CPI, but has slightly different weightings and scope. For example, in healthcare services, the CPI only measures out-of-pocket expenses, while the PCE Price Index covers all costs, including those paid by health insurance or government programs. Economists often exclude food and energy prices, not because they don’t matter, but because these prices are volatile and we are interested in the underlying trend. Sharp increases in commodity prices get a lot of attention. However, as former Fed Chair Ben Bernanke noted, “the direct effects of commodity price inflation on consumer inflation are empirically minuscule, both because raw material costs are a small portion of total cost and because part of any increase in the cost of materials tends to be absorbed in the margins of final goods producers and distributors.”
Potential sources of inflation
Money supply measures surged in the pandemic. However, the relationship between the monetary aggregates (M1, M2, etc.1 ), growth and inflation broke down in the late 1980s. The velocity, or turnover, of money in the economy has slowed. The surge in liquidity during the pandemic helped relieve financial strains, supported growth, and lifted asset prices, but has not boosted inflation. Large federal budget deficits do not cause higher inflation. In the 1980s, the U.S. ran deficits on the order of 5% of gross domestic product (GDP), while inflation fell. The Japanese government has a debt-to-GDP ratio of over 235%, yet continues to battle deflation – a general decline in the price level.
The pandemic has disrupted supply chains, lengthening supplier delivery times and raising input costs, but these pressures should recede as vaccines are distributed and supply chains recover. However, while prices of industrial supplies and raw materials have increased, U.S. firms continue to face difficulties in passing higher costs along and there is little inflation in imported finished goods. The U.S. trade deficit widened during the pandemic, putting some downward pressure on the exchange rate of the dollar (if not offset by increased capital inflows) and upward pressure on commodity prices. However, the growth outlook for the U.S. is stronger than other advanced economies, which should help to support the greenback. With a limited ability to spend during the pandemic, household savings have increased. As the service side of the economy rebounds, strong demand could lead to higher prices for travel and hotels. However, there are plenty of empty hotel rooms and idle airplanes sitting on runways in the desert.
Monitoring and regulating
Economists view inflation as being driven by two factors: inflation expectations and the degree of economic slack (such as the unemployment rate or difference between GDP and its potential). Inflation expectations, as measured through surveys of professional forecasts or through market measures (such as the spread between inflation-adjusted and fixed-rate Treasuries) have remained well-anchored. Breakeven inflation rates, the spread between inflation-adjusted and fixed-rate Treasury securities, provide a rough estimate of inflation expectations. The 5-year breakeven rate has risen to about 2.4%, consistent with the Fed’s revised monetary policy framework. The 10-year breakeven rate implies an inflation rate of 2% five years out, consistent with the Fed’s long-term goal.
There should be ample slack in the economy well into next year. The rebound in consumer services is likely to be brisk once the pandemic is behind us, but there may be some difficulties in matching workers to jobs. Yet, one of the lessons learned from the pre-pandemic decade is that there is a lot more slack in the jobs market than would be indicated by the unemployment rate.
The Congressional Budget Office provides an estimate of potential GDP based on expectations of maximum sustainable employment and productivity growth. Vaccines will be distributed much faster than was expected earlier, and with continued accommodation from the Fed and further fiscal support, real GDP is likely to approach potential GDP sooner and may even exceed it. That would imply increased inflation pressures, although estimates of potential GDP are inherently unreliable.
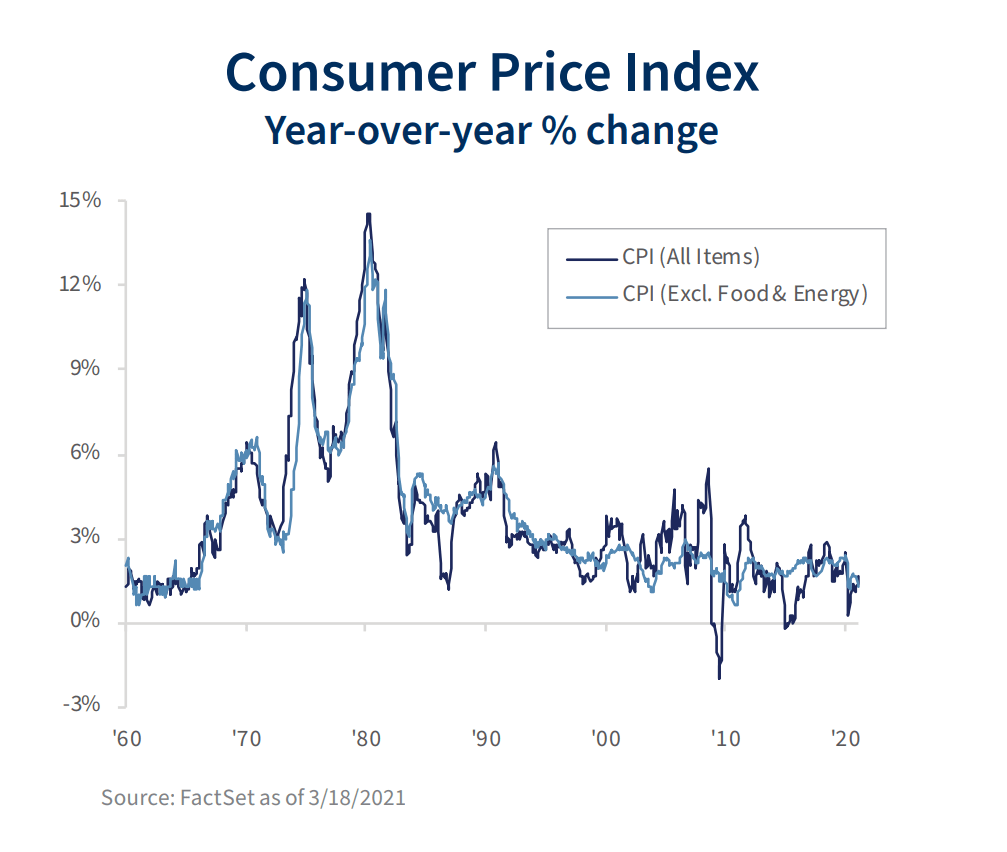
Inflation rose to double digits in the 1970s and early 1980s. The difference between now and then is inflation expectations. Following the OPEC oil shocks, the CPI rose sharply, reflecting higher energy prices. Unions were able to contract for higher wage gains and non-union wages followed. Inflation became embedded in the labor market and inflation expectations rose. In the private sector, union membership is now a fraction of what it was a few decades ago. Unless longer-term inflation expectations become wildly unanchored, inflation is unlikely to become a serious issue.

Read the full
Investment Strategy Quarterly

Read the full
Investment Strategy Quarterly
1 M1 and M2 are measurements of the United States money supply, known as the money aggregates. M1 includes money in circulation plus checkable deposits in banks. M2 includes M1 plus savings deposits (less than $100,000) and money market mutual funds.
Investment Strategy Quarterly is intended to communicate current economic and capital market information along with the informed perspectives of our investment professionals. You may contact your financial advisor to discuss the content of this publication in the context of your own unique circumstances. Published 4/1/2021.
Markets & Investing Members of the Raymond James Investment Strategy Committee share their views on...
Markets & Investing Review the latest Weekly Headings by CIO Larry Adam. Key Takeaways ...
Technology & Innovation Learn about a few simple things you can do to protect your personal information...