Chief Economist Eugenio J. Alemán discusses current economic conditions.
The January 2023 personal income and expenditures report was another confirmation that the U.S. economy is far from slowing down, even as the Federal Reserve (Fed) continues to increase interest rates in order to try to push businesses to slow down hiring and prepare for a potential recession – a potential recession they seem to want more now than before, as inflation seems to have continued to defy expectations.
Although the January 2023 numbers were impressive, the trend may not continue in the following months because it is clear that a warmer winter contributed to Americans going all out in January, while employers were also hiring lots of workers during the first month of the year although we have heard lots of conspiracy theories regarding the way statistical agencies deal with seasonal adjustment factors and how that is distorting the numbers.
However, the truth is that December 2022 was a very cold month across the country and January 2023 was a very warm month across the country. Furthermore, it is also clear that even when we seasonally adjust for weather events like these, December 2022 seemed to have been a particularly weak month while January 2023 was just the opposite, a particularly strong month, even when seasonally adjusting the data so don’t believe the conspiracy theorists.
This also means that these numbers may not be repeated because February 2023, or at least the end of the month, will be a particularly cold month and we will have to wait and see how the weather earlier in the month, compared to later in the month, affected individuals’ consumption patterns as well as firms hiring patterns. Next Friday, we will get the employment numbers for February and that will shed some light on firms’ side of the equation. However, we will not have information on consumption patterns for February 2023 until at least mid-March 2023.
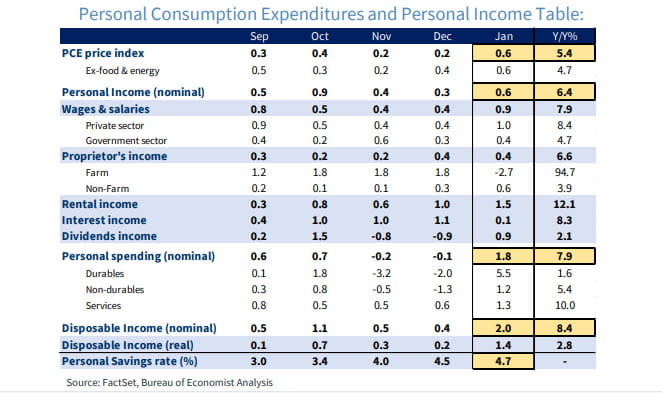
Perhaps the most important news from this report was that, with the exception of the PCE price index, all the rest of the data looked positive, and this will probably mean that the first quarter of the year is going to be a relatively strong quarter. Growth in disposable personal income was very strong in both nominal as well as in real terms while personal consumption expenditures was also very strong, also in nominal as well as in real terms. But this wasn’t all: The saving rate, that is, saving as a percentage of disposable personal income increased to 4.7%, an impressive recovery after decreasing to 2.7% in June 2022. Not only did Americans have enough income to go around spending but they managed to increase their saving rate at the same time.
However, while this was good news for the economy, disposable personal income was strong because personal current taxes declined by an impressive 7.9% annualized rate during the first month of the year, something that will probably not be repeated in the months to come.
Nevertheless, the most important number in today’s release was the saving rate. This is what the Fed wants to see and although we don’t want to go on a limb here and say, “job well done,” the increase in interest rates may be starting to push Americans to consider saving rather than consuming, as interest rates on saving accounts have increased considerably. Americans did not have to choose between consuming and saving because there was enough to do both, but it will be interesting to see whether Americans keep saving at a higher rate in the coming months even in the face of not-so-strong disposable income growth.
Revisions to GDP growth during Q4 2022
The Bureau of Economic Analysis (BEA) revised real GDP growth during the last quarter of 2022 slightly downward, from an original 2.9% increase to a revised 2.7% increase at a seasonally adjusted annual rate. The bulk of the downward revision was due to weaker consumer demand, or a weaker performance by personal consumption expenditures (PCE). PCE increased at a 1.4% rate compared to an originally published rate of 2.1%, with most of the weakness accruing to the consumption of goods. Goods consumption declined 0.5% during the last quarter of 2022 compared to an original increased of 1.1%.
The downward revision to consumer demand was partially compensated by an upward revision to gross private domestic investment, which was originally reported to have increased by 1.4% and was revised upwards to a growth rate of 3.7%. The most important revision in this category was an upward revision to nonresidential investment in structures, up 8.5% compared to an originally reported rate of just 0.4%.
The revisions meant that PCE contributed 0.93 percentage points to Q4 GDP growth rather than 1.42 percentage points as it was initially reported while gross private domestic investment contributed 0.66 percentage points to Q4 GDP growth rather than 0.27 percentage points as originally reported. Meanwhile, net exports contributed 0.46 percentage points compared to an original estimate of 0.56 percentage points while government consumption expenditures and gross investment contribution went from 0.64 percentage points in the first release to 0.63 percentage points in the revision. Lastly, changes to private inventories contributed 1.47 percentage points to Q4 GDP growth compared to an original estimate of 1.46 percentage points.
The overall revision to GDP in the fourth quarter of the year, however, did not change the overall performance of the US economy during 2022, as it grew 2.1% during the whole of 2022 compared to 2021 after surging 5.9% during 2021 compared to the previous year as the U.S. economy recovered after the COVID-19 induced recession.
Economic and market conditions are subject to change.
Opinions are those of Investment Strategy and not necessarily those of Raymond James and are subject to change without notice. The information has been obtained from sources considered to be reliable, but we do not guarantee that the foregoing material is accurate or complete. There is no assurance any of the trends mentioned will continue or forecasts will occur. Last performance may not be indicative of future results.
Consumer Price Index is a measure of inflation compiled by the U.S. Bureau of Labor Statistics. Currencies investing is generally considered speculative because of the significant potential for investment loss. Their markets are likely to be volatile and there may be sharp price fluctuations even during periods when prices overall are rising.
Consumer Sentiment is a consumer confidence index published monthly by the University of Michigan. The index is normalized to have a value of 100 in the first quarter of 1966. Each month at least 500 telephone interviews are conducted of a contiguous United States sample.
Personal Consumption Expenditures Price Index (PCE): The PCE is a measure of the prices that people living in the United States, or those buying on their behalf, pay for goods and services. The change in the PCE price index is known for capturing inflation (or deflation) across a wide range of consumer expenses and reflecting changes in consumer behavior.
The Consumer Confidence Index (CCI) is a survey, administered by The Conference Board, that measures how optimistic or pessimistic consumers are regarding their expected financial situation. A value above 100 signals a boost in the consumers’ confidence towards the future economic situation, as a consequence of which they are less prone to save, and more inclined to consume. The opposite applies to values under 100.
Leading Economic Index: The Conference Board Leading Economic Index is an American economic leading indicator intended to forecast future economic activity. It is calculated by The Conference Board, a non- governmental organization, which determines the value of the index from the values of ten key variables
Certified Financial Planner Board of Standards Inc. owns the certification marks CFP®, Certified Financial Planner™, CFP® (with plaque design) and CFP® (with flame design) in the U.S., which it awards to individuals who successfully complete CFP Board’s initial and ongoing certification requirements.
Links are being provided for information purposes only. Raymond James is not affiliated with and does not endorse, authorize or sponsor any of the listed websites or their respective sponsors. Raymond James is not responsible for the content of any website or the collection or use of information regarding any website’s users and/or members.
GDP Price Index: A measure of inflation in the prices of goods and services produced in the United States. The gross domestic product price index includes the prices of U.S. goods and services exported to other countries. The prices that Americans pay for imports aren’t part of this index.
FHFA House Price Index: The FHFA House Price Index is the nation’s only collection of public, freely available house price indexes that measure changes in single-family home values based on data from all 50 states and over 400 American cities that extend back to the mid-1970s.
Expectations Index: The Expectations Index is a component of the Consumer Confidence Index® (CCI), which is published each month by the Conference Board. The CCI reflects consumers’ short-term—that is, six- month—outlook for, and sentiment about, the performance of the overall economy as it affects them.
Present Situation Index: The Present Situation Index is an indicator of consumer sentiment about current business and job market conditions. Combined with the Expectations Index, the Present Situation Index makes up the monthly Consumer Confidence Index.
Pending Home Sales Index: The Pending Home Sales Index (PHS), a leading indicator of housing activity, measures housing contract activity, and is based on signed real estate contracts for existing single-family homes, condos, and co-ops. Because a home goes under contract a month or two before it is sold, the Pending Home Sales Index generally leads Existing-Home Sales by a month or two.
DISCLOSURES
Import Price Index: The import price index measure price changes in goods or services purchased from abroad by
U.S. residents (imports) and sold to foreign buyers (exports). The indexes are updated once a month by the Bureau of Labor Statistics (BLS) International Price Program (IPP).
ISM New Orders Index: ISM New Order Index shows the number of new orders from customers of manufacturing firms reported by survey respondents compared to the previous month.ISM Employment Index: The ISM Manufacturing Employment Index is a component of the Manufacturing Purchasing Managers Index and reflects employment changes from industrial companies.
ISM Inventories Index: The ISM manufacturing index is a composite index that gives equal weighting to new orders, production, employment, supplier deliveries, and inventories.
ISM Production Index: The ISM manufacturing index or PMI measures the change in production levels across the
U.S. economy from month to month.
ISM Services PMI Index: The Institute of Supply Management (ISM) Non-Manufacturing Purchasing Managers’ Index (PMI) (also known as the ISM Services PMI) report on Business, a composite index is calculated as an indicator of the overall economic condition for the non-manufacturing sector.
Source: FactSet, data as of 12/29/2022
Markets & Investing April 01, 2024 Raymond James CIO Larry Adam reminds investors they need to be well...
Markets & Investing April 01, 2024 Doug Drabik discusses fixed income market conditions and offers...
Markets & Investing April 01, 2024 Market rally driven by a broadening of the market and optimism that...