Chief Economist Eugenio J. Alemán discusses current economic conditions.
Last week we changed our economic forecast because the economy has remained stronger than we expected. We delayed the start of the recession to the first quarter of 2024 rather than the last quarter of 2023. There were several reasons for the change. First, employment has remained stronger than what we had expected, and it is unlikely to weaken enough over the next few months, therefore making it improbable that a recession will start during the last quarter of the year.
Second, the administration’s passage of several bills last year, including the Inflation Reduction Act (IRA), the CHIPS Act, and the Infrastructure bill, have contributed to a stronger investment profile than what would have been expected with such a strong increase in interest rates over the last year and a half. That is, although the increase in interest rates has had an important negative effect on residential investment, nonresidential investment has continued to perform well because of the added stimulus brought about by these bills. Furthermore, according to new research by the Chicago Federal Reserve (Fed), the responsiveness of monetary policy on investment has been “delayed,” they argue, because the profile of investment has changed considerably over the years, from mostly investments in tangible assets, which react faster to monetary policy decisions, to increased investment in what is called “intangible” investments, that is investments in assets such as intellectual property or software.1
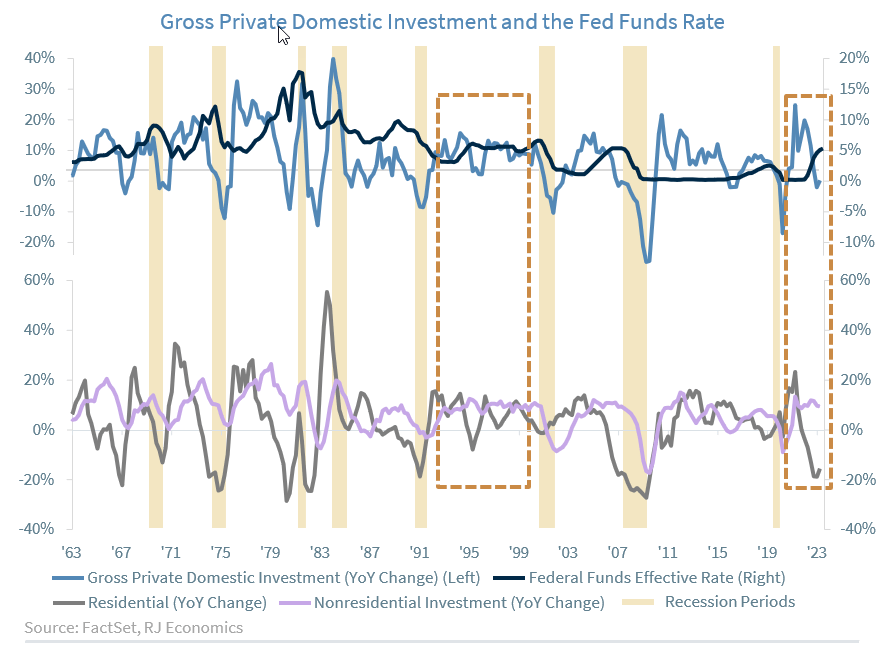
In the graph above, we have plotted the federal funds rate and overall real investment at the top and then below we split real investment into real residential investment and real nonresidential investment. Also, recall that nonresidential investment is about two-thirds of total real investment spending while residential investment is the remaining one-third. The graph shows the strong negative effects of higher interest rates on real residential investment but almost no effects on nonresidential investment. Furthermore, as the graph clearly shows, today’s scenario is eerily similar to what happened back in 1994-1995 when the Fed engineered what some call a ‘soft landing.’
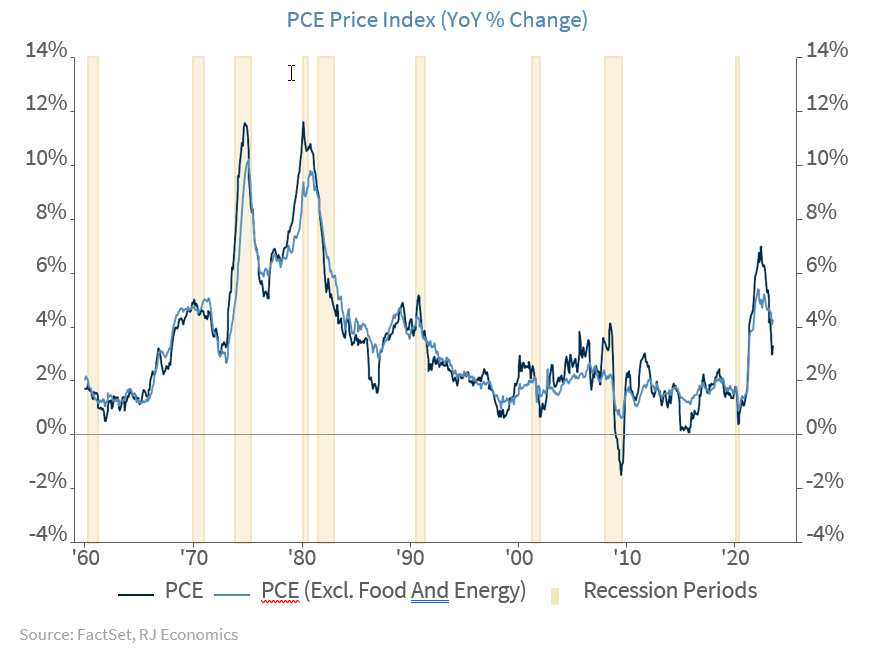
Perhaps the biggest question is what was happening to inflation at that time and what is happening to inflation today. In the 1994-1995 period, year-over-year the PCE price index as well as the PCE price index excluding food and energy were declining, i.e., disinflating, and very close to the 2.0% target. However, today, these two indices are also disinflating but are still very far away from the 2.0% Fed target (see graph below). Of course, if Fed officials believe that they have done enough to keep the disinflationary process going, then they may change their minds and not increase rates again. If this is the case, they may even be able to engineer another ‘soft landing’ as they did back in the mid-1990s. However, if Fed officials believe that the risks for inflation remain high, they may be willing to increase interest rates again. As it stands today, we still believe that the Fed is going to hike once more before the end of this year.
We will update our forecast for the federal funds rate once Fed officials release the Summary of Economic Projections, which will include the new ‘dot plot,’ after the September meeting of the Federal Open Market Committee meeting scheduled for September 19-20.
Economic and market conditions are subject to change.
Opinions are those of Investment Strategy and not necessarily those of Raymond James and are subject to change without notice. The information has been obtained from sources considered to be reliable, but we do not guarantee that the foregoing material is accurate or complete. There is no assurance any of the trends mentioned will continue or forecasts will occur. Last performance may not be indicative of future results.
Consumer Price Index is a measure of inflation compiled by the US Bureau of Labor Statistics. Currencies investing is generally considered speculative because of the significant potential for investment loss. Their markets are likely to be volatile and there may be sharp price fluctuations even during periods when prices overall are rising.
Consumer Sentiment is a consumer confidence index published monthly by the University of Michigan. The index is normalized to have a value of 100 in the first quarter of 1966. Each month at least 500 telephone interviews are conducted of a contiguous United States sample.
Personal Consumption Expenditures Price Index (PCE): The PCE is a measure of the prices that people living in the United States, or those buying on their behalf, pay for goods and services. The change in the PCE price index is known for capturing inflation (or deflation) across a wide range of consumer expenses and reflecting changes in consumer behavior.
The Consumer Confidence Index (CCI) is a survey, administered by The Conference Board, that measures how optimistic or pessimistic consumers are regarding their expected financial situation. A value above 100 signals a boost in the consumers’ confidence towards the future economic situation, as a consequence of which they are less prone to save, and more inclined to consume. The opposite applies to values under 100.
Certified Financial Planner Board of Standards Inc. owns the certification marks CFP®, CERTIFIED FINANCIAL PLANNER™, CFP® (with plaque design) and CFP® (with flame design) in the U.S., which it awards to individuals who successfully complete CFP Board’s initial and ongoing certification requirements.
Links are being provided for information purposes only. Raymond James is not affiliated with and does not endorse, authorize or sponsor any of the listed websites or their respective sponsors. Raymond James is not responsible for the content of any website or the collection or use of information regarding any website’s users and/or members.
GDP Price Index: A measure of inflation in the prices of goods and services produced in the United States. The gross domestic product price index includes the prices of U.S. goods and services exported to other countries. The prices that Americans pay for imports aren’t part of this index.
The Conference Board Leading Economic Index: Intended to forecast future economic activity, it is calculated from the values of ten key variables.
The Conference Board Coincident Economic Index: An index published by the Conference Board that provides a broad-based measurement of current economic conditions.
The Conference Board lagging Economic Index: an index published monthly by the Conference Board, used to confirm and assess the direction of the economy’s movements over recent months.
The U.S. Dollar Index is an index of the value of the United States dollar relative to a basket of foreign currencies, often referred to as a basket of U.S. trade partners’ currencies. The Index goes up when the U.S. dollar gains “strength” when compared to other currencies.
The FHFA House Price Index (FHFA HPI®) is a comprehensive collection of public, freely available house price indexes that measure changes in single-family home values based on data from all 50 states and over 400 American cities that extend back to the mid-1970s.
Import Price Index: The import price index measure price changes in goods or services purchased from abroad by U.S. residents (imports) and sold to foreign buyers (exports). The indexes are updated once a month by the Bureau of Labor Statistics (BLS) International Price Program (IPP).
ISM New Orders Index: ISM New Order Index shows the number of new orders from customers of manufacturing firms reported by survey respondents compared to the previous month. ISM Employment Index: The ISM Manufacturing Employment Index is a component of the Manufacturing Purchasing Managers Index and reflects employment changes from industrial companies.
ISM Inventories Index: The ISM manufacturing index is a composite index that gives equal weighting to new orders, production, employment, supplier deliveries, and inventories.
ISM Production Index: The ISM manufacturing index or PMI measures the change in production levels across the U.S. economy from month to month.
ISM Services PMI Index: The Institute of Supply Management (ISM) Non-Manufacturing Purchasing Managers’ Index (PMI) (also known as the ISM Services PMI) report on Business, a composite index is calculated as an indicator of the overall economic condition for the non-manufacturing sector.
Consumer Price Index (CPI) A consumer price index is a price index, the price of a weighted average market basket of consumer goods and services purchased by households. Changes in measured CPI track changes in prices over time.
Producer Price Index: A producer price index (PPI) is a price index that measures the average changes in prices received by domestic producers for their output.
Industrial production: Industrial production is a measure of output of the industrial sector of the economy. The industrial sector includes manufacturing, mining, and utilities. Although these sectors contribute only a small portion of gross domestic product, they are highly sensitive to interest rates and consumer demand.
The NAHB/Wells Fargo Housing Opportunity Index (HOI) for a given area is defined as the share of homes sold in that area that would have been affordable to a family earning the local median income, based on standard mortgage underwriting criteria.
The S&P CoreLogic Case-Shiller U.S. National Home Price NSA Index measures the change in the value of the U.S. residential housing market by tracking the purchase prices of single-family homes.
The S&P CoreLogic Case-Shiller 20-City Composite Home Price NSA Index seeks to measures the value of residential real estate in 20 major U.S. metropolitan.
Source: FactSet, data as of 7/7/2023
Markets & Investing April 01, 2024 Market rally driven by a broadening of the market and optimism that...
Markets & Investing April 01, 2024 Doug Drabik discusses fixed income market conditions and offers...
Markets & Investing April 01, 2024 Raymond James CIO Larry Adam reminds investors they need to be well...