Chief Economist Eugenio J. Alemán discusses current economic conditions.
December’s 0.1% decline in the headline consumer price index (CPI) was a good number with which to end the year but the 0.3% increase in the core CPI number meant that the Federal Reserve (Fed) still has some more work to do in terms of interest rates even though we still believe that it is very close to ending this monetary tightening cycle. Furthermore, we expect shelter prices, which remained strong in 2022, to start weakening by mid-2023 and that is going to add some impetus to the current disinflationary process. However, as we argue in the section below, the picture for inflation and for inflation targeting by the Fed is still not market friendly.
Meanwhile, January 2023 consumer sentiment, as measured by the University of Michigan Consumer Sentiment Index, improved more than expected while one-year ahead inflation expectations declined to the lowest reading since April 2021. This decline in short-term inflation expectations was a good development for the Fed but five-years ahead inflation expectations moved slightly higher, from 2.9% in December to a preliminary reading of 3.0% in January of this year. Note: this is within the range we have experienced over the last year and a half.
Why is the Federal Reserve Taking Such a Hawkish Stance on Inflation?
According to the Fed, “The Federal Open Market Committee (FOMC) judges that inflation of 2 percent over the longer run, as measured by the annual change in the price index for personal consumption expenditures, is most consistent with the Federal Reserve’s mandate for maximum employment and price stability.”
We bolded the words “over the longer run” in the previous paragraph because this is the most important concept of inflation targeting and probably the reason why Fed officials are so hawkish today. Why is “over the longer run” the key to the above paragraph as well as to the Fed’s hawkishness today? The reason is that the Fed has allowed the rate of inflation to overshoot this 2% target for two years and they need to push this “over the longer-run” average down as fast as possible. Therefore not only does it need to get to 2%, but the Fed also probably needs to undershoot inflation for several years so that inflation returns to the 2% target “over the longer run.”
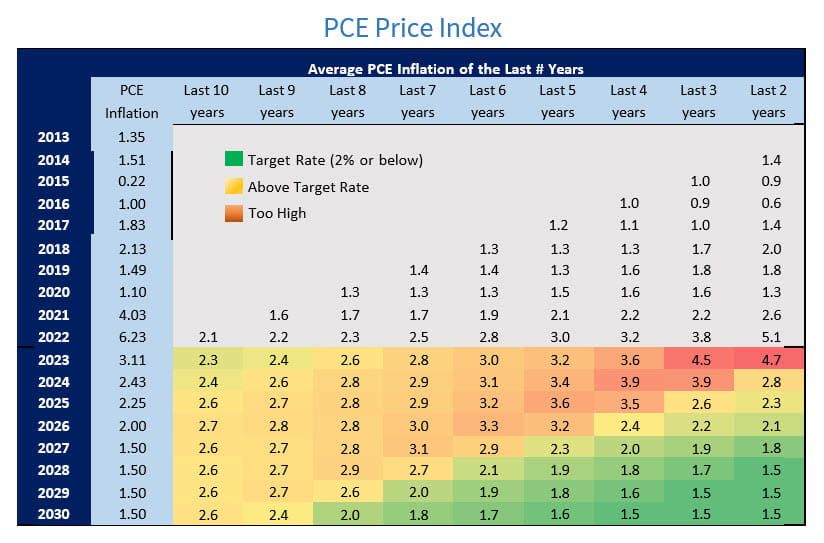
By looking at the table on the next page it is clear, and we are making a value judgment here, that what Fed officials consider to be this “longer run” period in this case, is a long-run term of two or three years at most. The table shows a hypothetical schedule for headline PCE inflation with different “longer-run” averages, going from ten years to just two years, in descending order. By analyzing this table, we clearly see that if this “longer run” is ten years, then, nobody would be really concerned about inflation today because the current ten-year average is very close to target, at 2.1%. But Fed officials know that, in this case, and assuming yearly inflation goes according to our forecast, inflation will not come close to 2% at least until past 2030. If it chooses the “longer run” to be eight years, then it would achieve 2% inflation in 2030. If it chooses “the longer run” to be seven years, then it will achieve 2% in 2029 and so forth.
But this means that the Fed will have to keep the U.S. economy from growing above potential output, that is, no more than 1.8%, for a very long time and we hope that is not what is built into Fed officials’ expectations. Thus, we believe the Fed’s intention is to keep the economy weak in 2023 and 2024, so it can bring the average rate of inflation to 2% “over the longer run.”
The only path to a “longer run” inflation is where Fed officials could get to something close to 2% in a relatively short period of time. At the same time, this path must show that inflation will remain in a declining trend towards the Fed’s 2% target. For the Fed to be more in tune, or somewhat closer to the market’s current expectations it is probably looking at an average time for its “over the longer run” of two years, as shown in the table below. Other paths will mean that it will reach a “two-percent handle” in 2025 or beyond. This is, perhaps, the reason why Fed officials have been beating the drum on “higher for longer” and remained extremely hawkish even if there is clear evidence today that inflation is coming down and, what the Fed has done so far, which is still working its way through the economy, is working.
Economic and market conditions are subject to change.
Opinions are those of Investment Strategy and not necessarily those of Raymond James and are subject to change without notice. The information has been obtained from sources considered to be reliable, but we do not guarantee that the foregoing material is accurate or complete. There is no assurance any of the trends mentioned will continue or forecasts will occur. Last performance may not be indicative of future results.
Consumer Price Index is a measure of inflation compiled by the U.S. Bureau of Labor Statistics. Currencies investing is generally considered speculative because of the significant potential for investment loss. Their markets are likely to be volatile and there may be sharp price fluctuations even during periods when prices overall are rising.
Consumer Sentiment is a consumer confidence index published monthly by the University of Michigan. The index is normalized to have a value of 100 in the first quarter of 1966. Each month at least 500 telephone interviews are conducted of a contiguous United States sample.
Personal Consumption Expenditures Price Index (PCE): The PCE is a measure of the prices that people living in the United States, or those buying on their behalf, pay for goods and services. The change in the PCE price index is known for capturing inflation (or deflation) across a wide range of consumer expenses and reflecting changes in consumer behavior.
The Consumer Confidence Index (CCI) is a survey, administered by The Conference Board, that measures how optimistic or pessimistic consumers are regarding their expected financial situation. A value above 100 signals a boost in the consumers’ confidence towards the future economic situation, as a consequence of which they are less prone to save, and more inclined to consume. The opposite applies to values under 100.
Leading Economic Index: The Conference Board Leading Economic Index is an American economic leading indicator intended to forecast future economic activity. It is calculated by The Conference Board, a non- governmental organization, which determines the value of the index from the values of ten key variables
Certified Financial Planner Board of Standards Inc. owns the certification marks CFP®, Certified Financial Planner™, CFP® (with plaque design) and CFP® (with flame design) in the U.S., which it awards to individuals who successfully complete CFP Board’s initial and ongoing certification requirements.
Links are being provided for information purposes only. Raymond James is not affiliated with and does not endorse, authorize or sponsor any of the listed websites or their respective sponsors. Raymond James is not responsible for the content of any website or the collection or use of information regarding any website’s users and/or members.
GDP Price Index: A measure of inflation in the prices of goods and services produced in the United States. The gross domestic product price index includes the prices of U.S. goods and services exported to other countries. The prices that Americans pay for imports aren’t part of this index.
FHFA House Price Index: The FHFA House Price Index is the nation’s only collection of public, freely available house price indexes that measure changes in single-family home values based on data from all 50 states and over 400 American cities that extend back to the mid-1970s.
Expectations Index: The Expectations Index is a component of the Consumer Confidence Index® (CCI), which is published each month by the Conference Board. The CCI reflects consumers’ short-term—that is, six- month—outlook for, and sentiment about, the performance of the overall economy as it affects them.
Present Situation Index: The Present Situation Index is an indicator of consumer sentiment about current business and job market conditions. Combined with the Expectations Index, the Present Situation Index makes up the monthly Consumer Confidence Index.
Pending Home Sales Index: The Pending Home Sales Index (PHS), a leading indicator of housing activity, measures housing contract activity, and is based on signed real estate contracts for existing single-family homes, condos, and co-ops. Because a home goes under contract a month or two before it is sold, the Pending Home Sales Index generally leads Existing-Home Sales by a month or two.
DISCLOSURES
Import Price Index: The import price index measure price changes in goods or services purchased from abroad by
U.S. residents (imports) and sold to foreign buyers (exports). The indexes are updated once a month by the Bureau of Labor Statistics (BLS) International Price Program (IPP).
ISM New Orders Index: ISM New Order Index shows the number of new orders from customers of manufacturing firms reported by survey respondents compared to the previous month.ISM Employment Index: The ISM Manufacturing Employment Index is a component of the Manufacturing Purchasing Managers Index and reflects employment changes from industrial companies.
ISM Inventories Index: The ISM manufacturing index is a composite index that gives equal weighting to new orders, production, employment, supplier deliveries, and inventories.
ISM Production Index: The ISM manufacturing index or PMI measures the change in production levels across the
U.S. economy from month to month.
ISM Services PMI Index: The Institute of Supply Management (ISM) Non-Manufacturing Purchasing Managers’ Index (PMI) (also known as the ISM Services PMI) report on Business, a composite index is calculated as an indicator of the overall economic condition for the non-manufacturing sector.
Source: FactSet, data as of 12/29/2022
Markets & Investing Members of the Raymond James Investment Strategy Committee share their views on...
Markets & Investing Review the latest Weekly Headings by CIO Larry Adam. Key Takeaways ...
Technology & Innovation Learn about a few simple things you can do to protect your personal information...